

A map should include the following components namely, the title, scale, direction, grid system, projection, legend, conventional signs and symbols.

Title
It indicates the purpose or theme of the map. Example: India – Physical, World – Political, Tamil Nadu – Transport.

Scale
Scale makes it possible to reduce the size of the whole earth to show it on a piece of paper. A scale is a ratio between the actual distance on the map to the actual distance on the ground. Scales can be represented in three methods. They are the Statement, Representative Fraction (R.F) and Linear or Graphical scale methods.

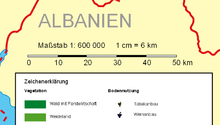
Statement scale
Scale makes it possible to reduce the size of the whole earth to show it on a piece of paper. A scale is a ratio between the actual distance on the map to the actual distance on the ground. Scales can be represented in three methods. They are the Statement, Representative Fraction (R.F) and Linear or Graphical scale methods.
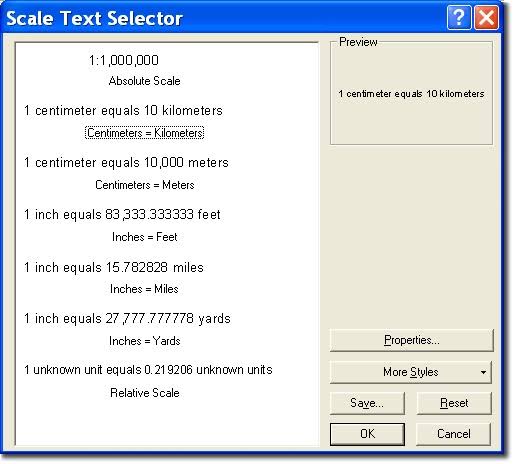
The Representative Fraction (R.F)
Representative Fraction (R.F) = Distance on the map/Distance on the ground
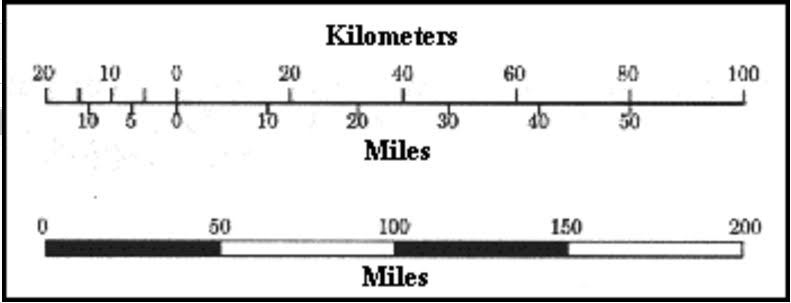
Linear or Graphical scale
In a map, a linear scale is represented by a straight line divided into equal parts (Primary and Secondary) to show what these markings represent on the actual ground. This scale helps in the direct measurement of distance on the map.
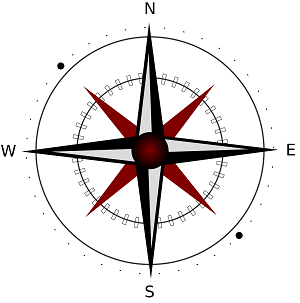
Direction
Maps are drawn normally with north orientation. North direction in a map is always towards the North Pole of the earth. If you position yourself looking at the North Pole, on your right will be the east; your left will be the west; at your back will be south. These four main directions are called the cardinal directions. Direction is usually indicated on a map by a North-South line, with the North direction represented by an arrow head.
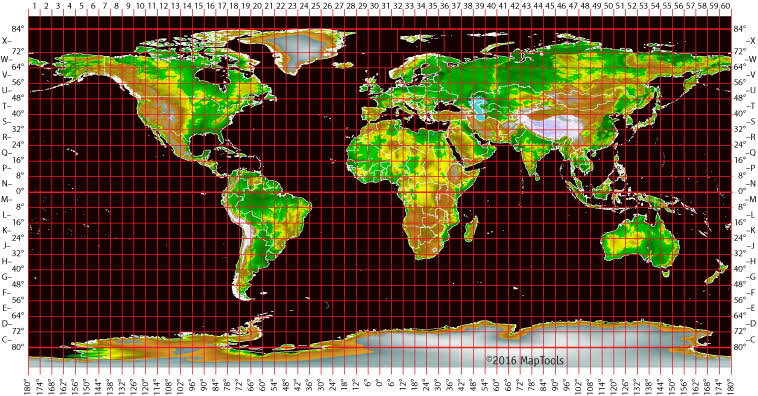
Grid System
The location of a place can be simply defined by its latitude and longitude. In normal practice, latitude is stated first and then comes the longitude. The latitude and longitude of a place can be expressed in units of degree, minutes and seconds.
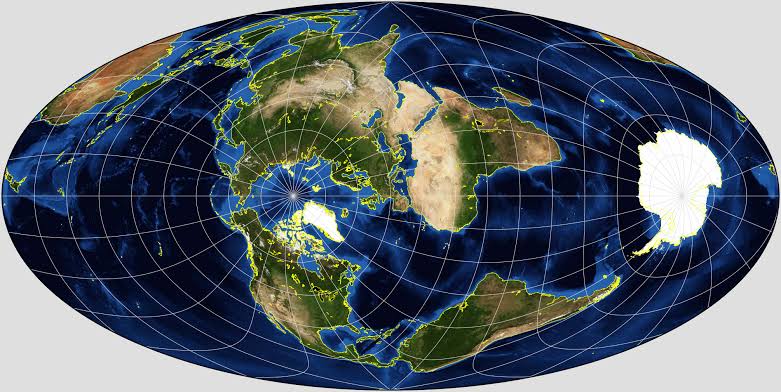
Projection
A map projection is a way of showing the spherical shaped earth on a flat piece of paper. Where does the word ‘projection’ come from? Imagine a clear globe with latitude and longitude lines and the outlines of the landmass on it. Suppose there was a light bulb inside the globe. If you wrapped a piece of paper around the globe and turned on the light bulb, the outlines of the grid and landmasses would be projected onto the paper. Map projection is defined as the transformation of spherical network of latitudes and longitudes on a plane surface. Projection are drawn to maintain the shape, area and direction.
The three methods in widest use are as follow:
• Projection on the surface of a cylinder
• Projection on to the surface of a cone
• Projection directly onto a flat plane, called planar or zenithal or azimuthal projection
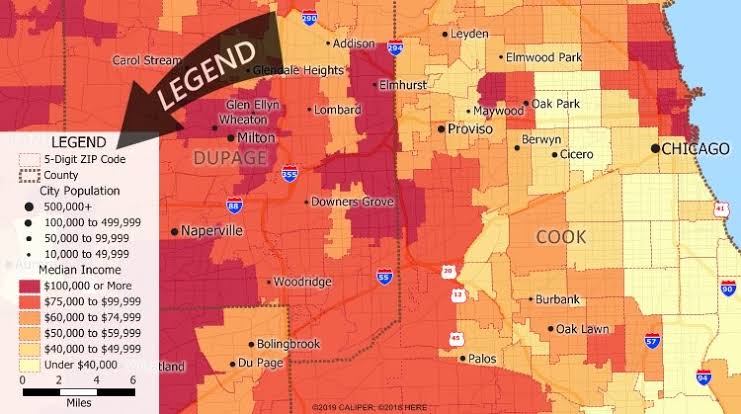
Legend
The legend of a map helps to understand the map details which are placed at the left or right corner at the bottom of the map.
Conventional signs and symbols
Conventional signs and symbols are standard symbols used on a map and explained in the legend to convey a definite meaning. The topographic map contains a variety of information about physical and cultural features.
These are shown by using signs and symbols in various colours so that the clarity of the map is maintained.
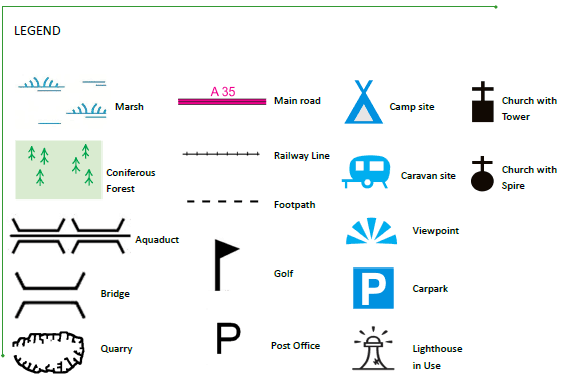
There are three types of map symbols
• Point Symbols – buildings, dipping tanks, trigonometrical beacons
• Line Symbols – railways, roads, power lines, telephone lines
• Area Symbols – Cultivated lands, ponds, orchards and vineyards


You must be logged in to post a comment.