

Innumerable theories are formulated by Haberler , Ohlin , Samuelson , Leontief , Hecksher and many others dealing with the macro and micro parts of international trade .
The principle of Comparative Cost theory by Ricardo, despite being the basis of international trade, has been criticized by many economists .
Ricardo’s theory of comparative cost is based on the labour theory of value which means that labour is the only factor of production and labour is homogeneous .
Such assumptions are found to be unrealistic .
Gottfired Haberler ‘ s theory of opportunity cost overcomes these shortcomings and explains the doctrine of the theory in terms of ” the substitution curve’ ‘ or as Samuelson entitled it as ” production possibility curve “or “transformation curve ” .
Lerner called it the ” production indifference curve ” or ” production frontier .”
Haberler’s theory is found to be more realistic .
The Theory of Opportunity cost
Opportunity cost is the value of loss when choosing between two or more commodities.
To elaborate more ,
The opportunity cost theory says that if a country can produce either commodity X or Y , the opportunity cost of commodity X is the amount of the other commodity Y that must be given up in order to get one additional unit of commodity X .
The exchange ratio between the two commodities is expressed in terms of their opportunity costs .
The decrease in the quantity of the second commodity represents the opportunity cost of the additional quantity of the given commodity.
Haberler used the concept of opportunity cost with production possibility curves to illustrate international trade theory.
Assumptions :-
The following assumptions are formulated by Haberler to illustrate the theory :-
• There are only two countries , (A,B)
• Each country possesses two factors of production – labour and capital.
• Each country can produce two commodities , ( X and Y ,)
• There is perfect competition in both the factor and commodity markets .
• The price of each commodity equals its marginal money costs .
• The price of each factor equals its marginal value productivity in each employment .
• The supply of each factor is fixed .
• Factors are immobile between the two countries.
•. There is no change in technology .
• Trade between the two countries is completely free and unrestricted.
Key terms :-
Production possibility curve :-
A production possibility curve or transformation curve is the curve that shows various combinations of two goods that can be produced with available amounts of resources .
Production possibility curve shows that if an economy wants to produce more of one commodity ,it will have to transfer or divert resources from the production of another commodity to produce the one .
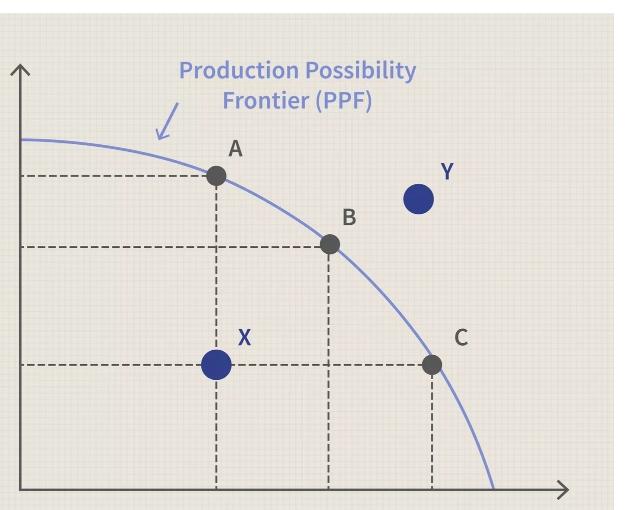
Different points on the production possibility curve show different combinations of the two goods . Points outside the curve are unattainable because of the scarce quantity of resources available.
Marginal Cost of Production :-
The marginal cost of production measures the change in the total cost of a good that arises from producing one additional unit of that good.
Marginal Rate Of Transformation :-
The marginal rate of transformation is the number of units of one product that can be increased by reducing the quantity of another product. It shows the number of goods that will be foregone to produce an additional unit of other goods while keeping the factors of production constant.
Comparative advantages: – A country can produce one commodity at a lower cost
than the other because of comparative advantages such
as favourable climate, natural resources, geographical
situation and efficiency of labour.
Explanation Of the Opportunity Cost Theory
The production possibility curve indicates such combinations of two commodities .
The shape of the production possibility curve determines the basis and the gain from international trade under the theory of opportunity curve .
The slope of the production possibility curve is determined by the ratio of units of the commodity given up in order to have one unit of the other commodity i.e by Marginal rate of transformation. (MRT)
MRT xy = ∆Y/ ∆X , where ,
X and Y are being produced by a country and some quantities of labour and capital input are used from the production of Y into the production process of commodity X.
Trade can take place only when each nation has a different MRT. The gains from trade for a particular nation depend on how much the
international exchange rates differ from that nation’s MRT. The greater the difference, the
greater is the gains from trade. The gains from trade rest further upon the amount of trade taking place. A larger volume of trade allows larger gains from trade and a greater
increase in the standard of living.
Following the assumptions , two countries say A and B enter into a trade together .
Two commodities X and Y are being produced by using various alternative combinations that a country can produce most efficiently by fully utilising it’s factor of production i.e labour and capital ,are homogeneous , with the available technology in the fixed proportion due to perfect substitutability .
Conditions :-
1:
Trade under Constant Opportunity Cost
The production possibility curve under constant opportunity cost is a straight line .
In the figure ,
PA is the production possibility curve of country A ,
PB is the production possibility curve of country B .
Country A can produce either
OP of Y , or
OA of X
Similarly , Country B can produce
OP of Y
OB of X .
The slope of the production possibility curve determines the relative price of the two commodities , since the opportunity cost of leaving a unit of one commodity in order to have an additional unit of another is constant , the cost ratio ( relative price ) is the same on all the points on the production possibility curve.
Since , the MRT is constant i.e the slope of the production possibility curve is also constant, trade between the two countries is not possible as no country stands to gain through the trade .
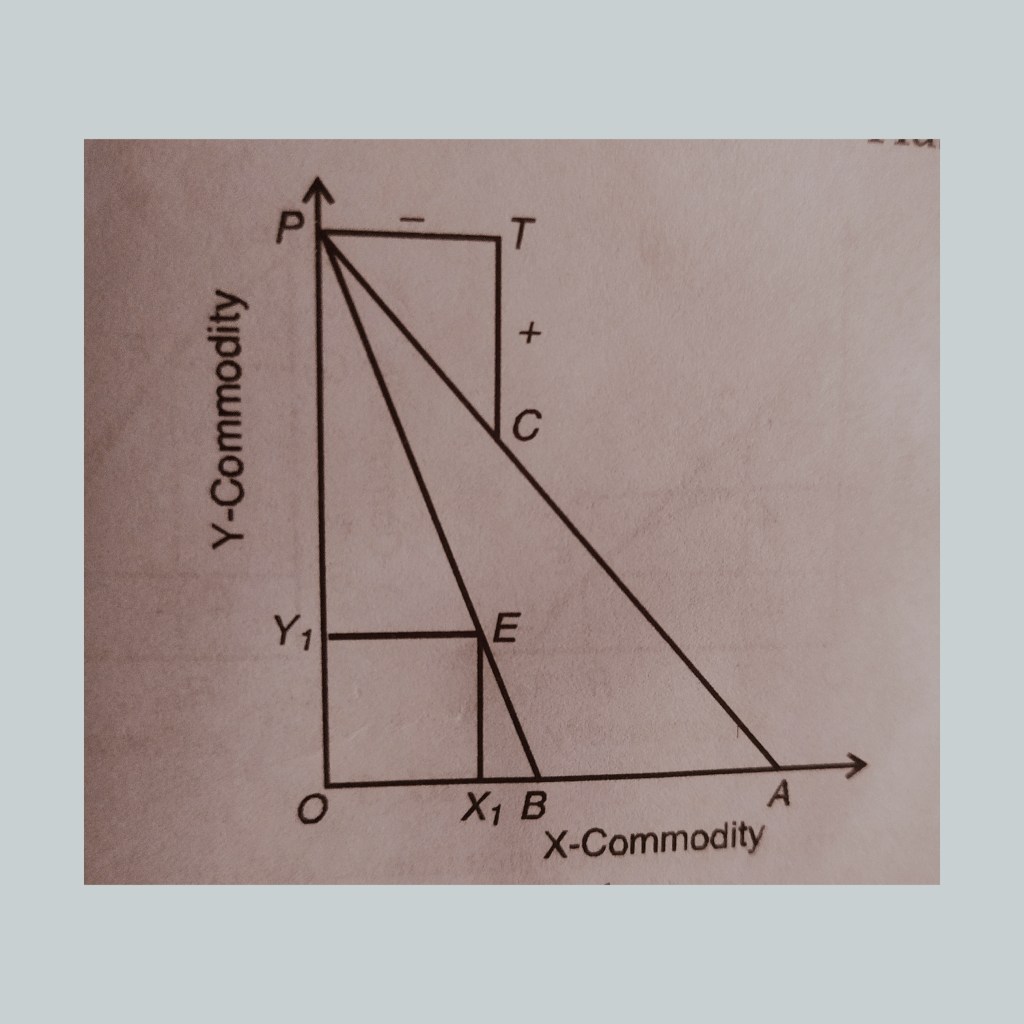
Trade Under Increasing Opportunity Cost :-
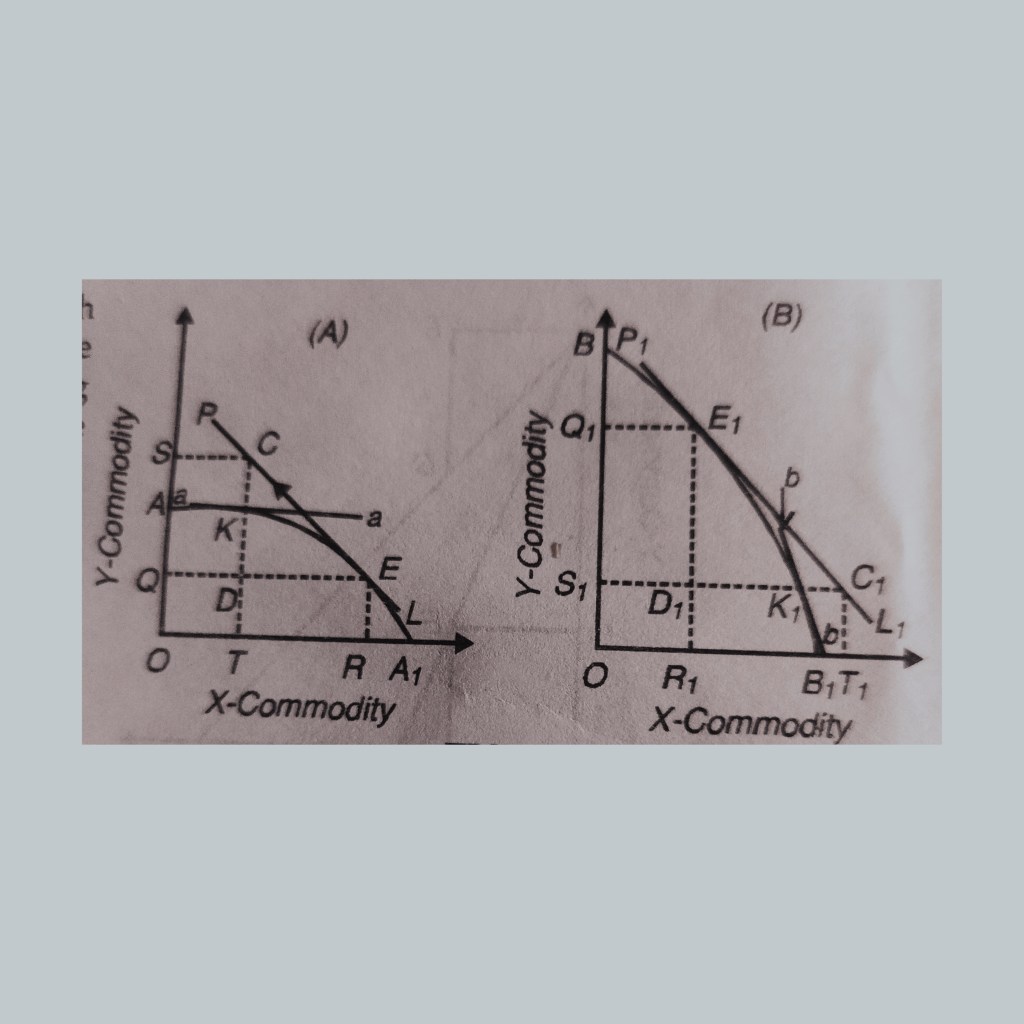
The production possibility curve under the increasing opportunity cost is concave to the origin because when a country specialises in the production of one commodity ,in which it possesses comparative advantage ,its opportunity costs increase .
In the above figure ,
AA1 is the production possibility curve of country A which is concave to the origin .
The slope of this curve shows that country A will specialise in the production of commodity X .
The larger amount of commodity Y will be given up to have additional amount of commodity X as we move from point A to A1
Thus ,the country faces increasing opportunity costs .
BB1 is the production possibility curve of a country which is concave to the origin .
The slope of this curve shows that country B will specialise in the production of commodity Y.
The larger amount of commodity Y will be given up to hsv additional amount of commodity Y as we move from B1` to B .
Thus , the country faces increasing opportunity costs.
Let us assume the international price ratio is given by the line PL in country A ,
and PL1 in country B.
The slope of line PL is greater than domestic price line aa ,making commodity X expensive in international market than in domestic market and resulting in the interest of country A to shift some factor of production from the production of commodity Y to commodity X , moving it’s production level from point K to point E.
It will export TR of X and import QS of Y ,
domestically consuming OT of X ,and OQ of Y .
The export and import can be shown by the “trade triangle ” CDE .
The slope of line PL1 is less steep than domestic price line bb ,making commodity Y expensive in international market than in domestic market and resulting in the interest of country B to shift some factor of production from the production of commodity X to commodity Y , moving it’s production level from point K1 to point E1
It will import D1C1 of X and export D1E1 of Y ,
domestically consuming OS1 of Y ,and OR1 of X.
The export and import can be shown by the “trade triangle ” C1E1D1.
Trade Under Constant Decreasing :-
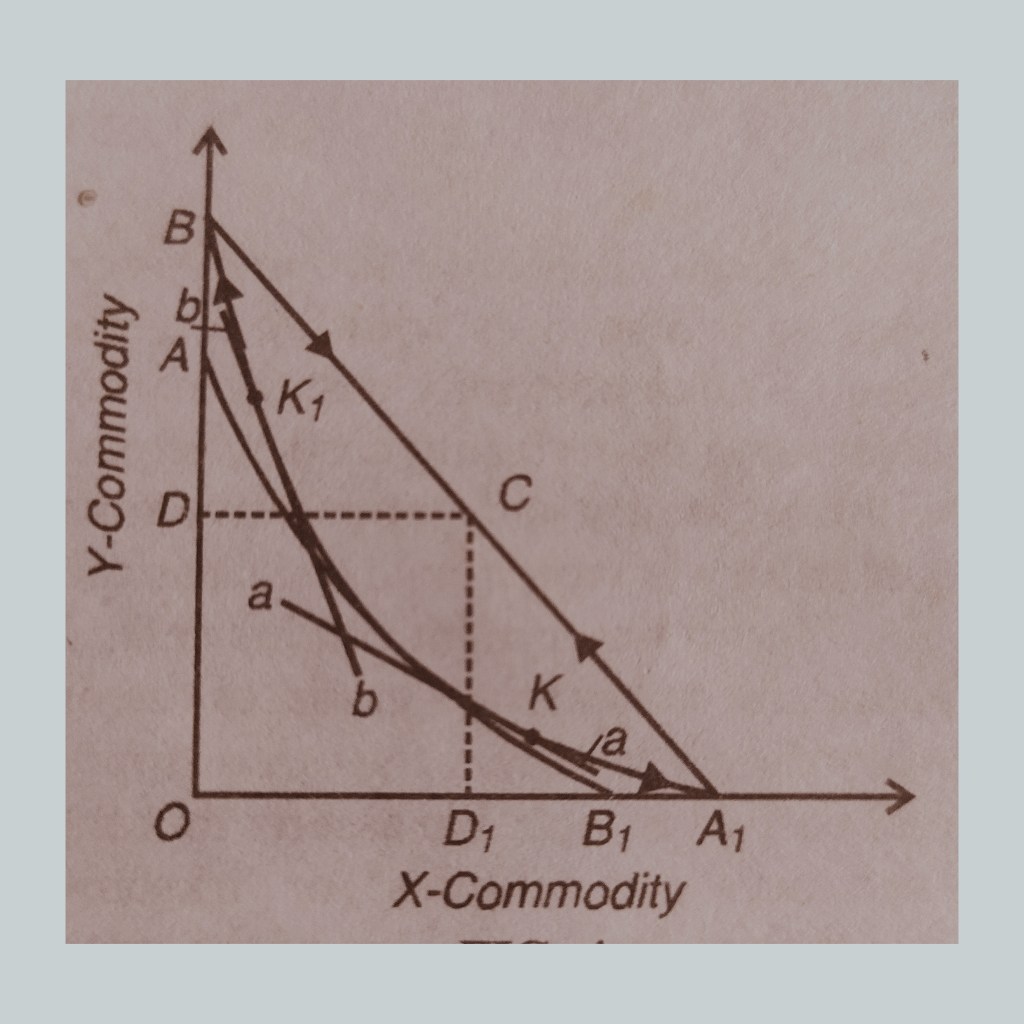
When two countries experience decreasing opportunity costs their production possibility curves are convex to the origin.
Under decreasing opportunity costs , each country completely specialises in the production of only one commodity after trade because there are increasing returns based on internal economies of production .
In the figure ,
The production possibility curve of country A is AA 1 and B is BB1.
The pre trade production and consumption point of country A is K where it’s domestic price line aa is tangent to its production possibility curve and country B is K1 , where it’s domestic price line bb is tangent to its production possibility curve.
The international price line being BA1, if both the countries enter the trade ,
BA1 is steeper than the domestic line of country A , making X more expensive in the international market and resulting in shifting of resources of production to X from K to A1 .
On the other hand , the international price line BA1 is flatter than the domestic price line bb of the country making Y commodity expensive in the international market than in the domestic market and resulting in shifting of resources of production to commodity Y and moving from K1 to B .
Thus , country A will completely specialise in commodity X and B in commodity Y .
Now both the countries will move along with the international price line BA1,
Country A from A to point A1 upward , country B from B to point B1 downward and reach point C in consumption.
Note :-
The straight line tangent represents :-
‘A straight line tangent to the transformation curve indicates the ratio of market prices
of the two commodities, and the condition of tangency expresses equilibrium in production, that is, equality between prices and marginal costs stated in opportunity terms. Domestic demand conditions enter into this construction via community indifference curves, or simply
as a consumption point determined by a given arrangement of production and income distribution.”
Finally, tangency of a line representing the equilibrium international price ratio to
both transformation function and community indifference curve indicates equilibrium in
exchange, that is:
(i) Equality domestically between the marginal rate of substitution in consumption and marginal rate of transformation in production, and
(ii) Equality of the value of exports and the value of imports.
Critical Appraisal
As an alternative to classical comparative theory , the opportunity cost theory is more realistic .
The opportunity cost theory analyses pre- trade and post – trade situations under constant , increasing and decreasing opportunity cost whereas comparative advantage theory is based on constant cost of production within a country and comparative advantage and disadvantage between two countries.
Jacob Viber in his ” Studies in The Theory of International Trade ” ( 1937) criticized the opportunity cost theory of values which is the basis of Haberler’s theory .
Some of his criticism were :-
• Neglecting of welfare
• Failure in measuring in terms of strain , sacrifice or disutility.
• Neglecting Change in Factors of Supplies .
• Unrealistic Assumptions .
Despite criticism ,the opportunity cost theory has been regarded as more fertile because it can be readily extended into a general equilibrium system .


You must be logged in to post a comment.