

Citation
Talamo, R. S., Reblora, R. M., Diaz, W. D. B.-O., & Macuto, M. T. V. (2026). Technology-Driven Food Waste Management at Crown Regency Hotel, Cebu City. International Journal of Research, 13(3), 139–157. https://doi.org/10.26643/ijr/11
Main Author:
Roselio Serafina Talamo
Co- Author:
Rona Marie Reblora
Welou Dil Bato-On Diaz
Maria Trinidad Victoria Macuto
University of Cebu Main Campus
Abstract
Crown Regency Hotel in Cebu City, Philippines. The hotel industry faces significant food waste challenges due to overproduction, inefficient inventory management, and lack of real-time data. Traditional practices like portion control and food repurposing have limited success in addressing the problem. This research focuses on the implementation of digital tools such as AI-driven forecasting, IoT-based monitoring, and digital inventory systems to minimize food waste across various stages of the supply chain, including procurement, storage, food preparation, and service.
The study applies the Technology Acceptance Model (TAM), Technological-Organizational-Environmental (TOE) Framework, and Circular Economy (CE) Model to evaluate the adoption of these technologies at Crown Regency Hotel. It also examines legal policies and barriers to adoption, including cost, technical complexity, and organizational resistance. A survey of hotel staff assesses the effectiveness of the technologies in reducing food waste and improving supply chain efficiency.
Results indicate that while technology can enhance operational efficiency and reduce waste, challenges in cost and implementation persist. The study provides recommendations to overcome these barriers and promote the adoption of food waste reduction technologies. It aims to contribute to sustainable practices in the hospitality sector, offering valuable insights for similar establishments and policymakers.
Keywords: Food Waste Management, Technology Adoption, Hospitality Industry
Rationale
In the Philippine hotel industry, especially in Cebu’s tourism-driven economy, food waste is both a financial liability and a sustainability issue. Crown Regency Hotel, with its extensive buffet and event catering services, operates at a scale where inefficiencies can lead to significant food losses.
Despite implementing traditional practices such as portion control and repurposing, food waste persists due to overproduction, poor inventory tracking, and lack of real-time data. Technological solutions such as digital inventory systems, AI-driven forecasting, and IoT-based monitoring are becoming increasingly relevant. However, the extent of their use at Crown Regency Hotel, their effectiveness, and barriers to adoption remain underexplored.
As a former chef, the researcher brings direct industry experience and a grounded understanding of operational realities in hotel kitchens. This case study seeks to bridge the gap between theory and practice, examining how technology can be more effectively leveraged to reduce food waste within the operational context of a high-profile hotel in Cebu.
Theoretical Background
Food waste in the Philippines is a crisis. It threatens food security. It weakens economic stability. It harms environmental sustainability. Technology is the game-changer. Digital solutions are emerging as the key to cutting waste across the food supply chain. This section explores the Technology Acceptance Model (TAM) as the anchor theory. It is reinforced by the Technological-Organizational-Environmental (TOE) Framework and the Circular Economy (CE) Model. Relevant legal policies and research findings are also examined.
Anchor Theory: Technology Acceptance Model (TAM)
Technology adoption isn’t random. It follows a pattern. The Technology Acceptance Model (TAM) (Davis, 1989) explains this. Two factors drive adoption: perceived usefulness and perceived ease of use. If a technology isn’t useful or user-friendly, it won’t be adopted.
In the Philippine food industry, digital tools like AI-driven forecasting, blockchain for food traceability, and IoT-based monitoring systems are potential solutions. But adoption depends on whether farmers, retailers, and supply chain managers see real value. Studies confirm this. Sarmiento & Concepcion (2021) found that agribusinesses embrace tech only when they see increased efficiency and cost savings. However, there are roadblocks. Digital illiteracy. Weak infrastructure. These barriers slow adoption. Identifying them is crucial. Addressing them is even more critical.
Technological-Organizational-Environmental (TOE) Framework
Technology adoption doesn’t happen in isolation. It’s influenced by three factors:
Technology – Are AI inventory systems available? Are smart sensors in place? Are digital donation platforms accessible?
Organization – Are food suppliers and logistics companies willing to invest in tech? Are they ready for integration?
Environment – Are government policies supportive? Is market demand pushing adoption? Do environmental concerns force change?
The Philippine government is making moves. The National Food Policy (Republic Act No. 11337) promotes food security and waste reduction. Public-private partnerships are on the rise (Panganiban, 2020). But is it enough? Adoption gaps remain. Solutions need acceleration.
Circular Economy (CE)
Model The Circular Economy (CE) Model (Ellen MacArthur Foundation, 2013) disrupts the wasteful “take-make-dispose” system. It introduces a new mindset: reuse, repurpose, regenerate. In food waste management, CE principles push for:
● Food upcycling – Turning overripe fruits into jams. Converting surplus vegetables into powders.
● Waste-to-energy projects – Transforming food waste into biogas or fertilizers.
● Redistribution strategies – Using mobile apps to redirect surplus food to communities in need.
It’s already happening. Organizations like The Philippine Food Bank Foundation and Good Food Grocer use technology to redistribute excess food, cutting both waste and hunger (Castillo, 2022). The impact is real. But scale is the challenge.
Laws shape the landscape. Key policies include:
● Republic Act No. 11337 (2019) – Establishes food waste reduction frameworks.
● Republic Act No. 10611 (2013) – Regulates food safety and waste management.
● Department of Agriculture Administrative Order No. 26 (2020) – Pushes digital solutions in agriculture.
● Republic Act No. 11293 (2019) – Promotes innovation in food supply chains.
Laws exist. But are they enforced? Are they effective? Implementation remains a challenge. Research backs these theories.
● Sarmiento & Concepcion (2021) – IoT sensors in supermarkets reduce spoilage.
● Panganiban (2020) – Blockchain improves traceability and cuts food loss.
● Castillo (2022) – Mobile food rescue apps fight hunger.
● Reyes & Santos (2021) – AI-driven forecasting minimizes overproduction.
● Technology works. Data proves it. Adoption is the next battle.
The evidence is clear. Technology can reduce food waste in the Philippines. The Technology Acceptance Model (TAM) explains adoption behaviors. The TOE Framework highlights critical adoption factors. The Circular Economy Model stresses sustainability. Supported by legal policies and research, this study aims to drive real change. The goal? Less waste. More efficiency. A sustainable future!
Statement of the Problem
Food waste remains a significant concern in the hospitality industry, impacting food security, environmental sustainability, and operational efficiency. Hotels, especially those with large-scale food and beverage operations, face challenges in managing inventory, forecasting demand, and minimizing spoilage.
At Crown Regency Hotel in Cebu, like many hospitality establishments, food waste may occur across different stages of its supply chain — from sourcing and storage to preparation and service. While technological innovations such as AI-driven forecasting, IoT monitoring, and digital inventory systems offer solutions, implementation can be hindered by cost, technical complexity, and organizational resistance.
This study investigates how technology is being utilized at Crown Regency Hotel to reduce food waste across its supply chain. It aims to uncover the effectiveness of these tools, the challenges faced, and the demographic factors that may influence adoption and implementation.
Specifically, it seeks to answer the following research questions:
1. What is the demographic profile of Crown Regency Hotel staff and management involved in the food supply chain, in terms of:
1.1 age;
1.2 gender;
1.3 industry sector;
1.4 level of technological adoption;
1.5 role in the supply chain?
2. What technological solutions are currently used at Crown Regency Hotel to reduce food waste in procurement, storage, food preparation, and service?
3. How effective are these technologies in minimizing food loss and improving supply chain efficiency in terms of:
3.1 reduction in food spoilage and waste;
3.2 improved inventory and demand forecasting;
3.3 enhanced supply chain coordination and transparency;
3.4 cost savings and operational efficiency?
4. What challenges does Crown Regency Hotel face in adopting and implementing technology-driven food waste solutions?
5. Is there a significant relationship between the respondents’ demographic profile and their adoption of food waste reduction technologies?
6. Is there a significant difference in the perceived effectiveness of technology-driven food waste solutions across different demographic groups?
7. Based on the findings, what strategies can be proposed to enhance the adoption of technology in reducing food waste across the supply chain?
Statement of the Null Hypotheses
At a 0.05 level of significance, the following null hypotheses will be tested:
Ho1: There is no significant relationship between the demographic profile of Crown Regency Hotel staff and their adoption of food waste reduction technologies.
Ho2: There is no significant difference in the effectiveness of technology-driven solutions when grouped according to demographic profiles.
Significance of the Study
● Crown Regency Hotel Management: Findings will inform strategies to reduce food waste, enhance efficiency, and promote sustainability within hotel operations.
● Hospitality Industry: Insights can be applied to similar establishments seeking to optimize food service operations through technology.
● Technology Providers: The study will highlight specific needs and barriers within the hotel setting, helping developers tailor their solutions.
● Policy Makers: Data may support localized policy-making and initiatives for food waste reduction in Cebu’s tourism sector.
● Consumers and Guests: Reducing waste leads to better resource use, potentially improving food quality and reducing costs.
● The Researcher: Offers an opportunity to connect practical experience as a former chef with empirical academic research.
● Future Researchers: Provides a case-based foundation for further studies on sustainable food systems in hotels and resorts.
Research Design
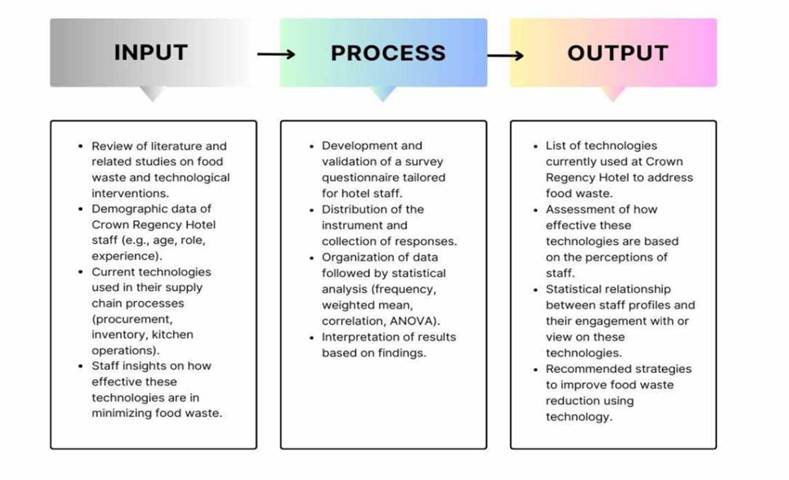
This study will employ a descriptive-correlational research design to examine how technology is used to reduce food waste at Crown Regency Hotel and to determine the relationship between demographic profiles and the adoption and effectiveness of food waste technologies. The descriptive aspect will document current practices, technologies used, and levels of effectiveness, while the correlational aspect will analyze possible relationships between demographic variables and technology adoption or perceived effectiveness.
INPUT-PROCESS-OUTPUT DIAGRAM
Research Environment
The research will be conducted at Crown Regency Hotel in Cebu City, Philippines. The hotel is a well-known hospitality establishment offering various food and beverage services, including buffets, in-room dining, and function catering. Given its large-scale operations, Crown Regency serves as an ideal environment to explore the role of technology in managing and minimizing food waste across different stages of its food supply chain.
Research Respondents/Subjects
The respondents of the study will include kitchen staff, food and beverage supervisors, procurement officers, inventory personnel, and management-level staff involved in food-related decision-making at Crown Regency Hotel. A total of 100 respondents will be purposively selected to ensure that participants have relevant roles in the food supply chain. Respondents will be categorized according to their department, years of service, age, and role in the supply chain to enable comparative and correlational analysis.
Research Instrument
The primary research instrument will be a structured survey questionnaire developed by the researcher and validated by field experts. The questionnaire will be divided into the following sections:
1. Demographic Profile – Includes age, gender, department, role, years of service, and level of technological engagement.
2. Technologies Used – Identifies the technological systems currently in place for food procurement, inventory, preparation, and service.
3. Perceived Effectiveness – Utilizes a Likert scale to measure perceptions of how effective the technologies are in reducing food waste.
4. Challenges and Barriers – Captures common obstacles in the implementation and usage of these technologies.
The instrument will undergo content validation by three experts in hospitality and research methodology before actual distribution.
Research Procedures
Gathering of Data
1. Approval and Permissions – A formal request will be submitted to the management of Crown Regency Hotel to conduct the study and gather data from relevant staff.
2. Validation of Instrument – The questionnaire will be reviewed by experts to ensure relevance, clarity, and reliability.
3. Distribution – Once approved, questionnaires will be distributed either in printed form or via a digital platform, depending on accessibility and the hotel’s preference.
4. Consent and Confidentiality – Informed consent will be obtained from all respondents. Participation will be voluntary, and data will be treated with strict confidentiality.
5. Collection and Screening – Completed surveys will be collected, checked for completeness, and encoded for analysis.
Treatment of Data
Data will be analyzed using the following statistical tools:
● Frequency and Percentage – To describe the demographic profile of the respondents.
● Weighted Mean – To determine the level of effectiveness and perception of food waste reduction technologies.
● Pearson r – To determine the correlation between demographic profiles and the adoption or perceived effectiveness of food waste technologies.
● ANOVA or t-test – To identify significant differences in perceptions and usage when grouped according to demographic variables.
All statistical analyses will be conducted using SPSS or another appropriate statistical software.
DEFINITION OF TERMS
To ensure clarity and precision in this study, the following key terms are defined operationally within the context of this research:
1. Food Waste – The disposal of food that is still fit for human consumption, occurring at various stages of the supply chain, including production, distribution, retail, and consumption, due to inefficiencies, spoilage, or mismanagement.
2. Supply Chain – The entire process of food production, processing, distribution, retail, and consumption, including the stakeholders and logistical systems involved in ensuring food reaches consumers.
3. Technological Solutions – Innovations and digital tools used to mitigate food waste, such as artificial intelligence (AI), blockchain, and the Internet of Things (IoT), which enhance supply chain efficiency and minimize losses.
4. Artificial Intelligence (AI) – Computer-driven systems that analyze data and provide predictive analytics for demand forecasting, inventory management, and food waste reduction.
5. Blockchain Technology – A decentralized digital ledger system used to enhance supply chain transparency by securely recording transactions and food tracking data to reduce inefficiencies and waste.
6. Internet of Things (IoT) – A network of interconnected devices that monitor food storage conditions, track supply chain logistics, and provide real-time data to reduce spoilage and food loss.
7. Predictive Analytics – The use of AI and data analytics to forecast supply and demand patterns, helping businesses optimize inventory management and reduce excess food production. 8. Inventory Management – The systematic control of food stock levels through digital tools and technology to prevent overstocking, spoilage, and unnecessary waste.
9. Supply Chain Transparency – The ability to track food products throughout the supply chain using technologies such as blockchain to ensure accountability and reduce inefficiencies leading to food loss.
10. Operational Efficiency – The extent to which businesses optimize their resources, reduce costs, and streamline processes through technology to minimize food waste and improve supply chain management.
11. Demographic Profile – The characteristics of the study’s respondents, including age, gender, industry sector, level of technological adoption, and role within the supply chain, which influence their interaction with food waste reduction technologies.
12. Adoption of Technology – The extent to which businesses and stakeholders within the food supply chain implement and integrate digital solutions for food waste reduction.
13. Food Spoilage – The deterioration of food due to microbial growth, poor storage conditions, or improper handling, resulting in loss before consumption.
14. Cost Savings – The financial benefits businesses gain by using technology to optimize food supply, reduce waste, and improve operational efficiency.
15. Policy Makers and Regulators – Government agencies and industry authorities responsible for creating and enforcing policies that support the adoption of technology to reduce food waste.
15. Policy Makers and Regulators – Government agencies and industry authorities responsible for creating and enforcing policies that support the adoption of technology to reduce food waste.
References
Sarker, A., Ahmmed, R., Ahsan, S. M., Rana, J., Ghosh, M. K., & Nandi, R. (2024). A comprehensive review of food waste valorization for the sustainable management of global food waste. Sustainable Food Technology.
Lim, M. K., Li, Y., Wang, C., & Tseng, M. L. (2021). A literature review of blockchain technology applications in supply chains: A comprehensive analysis of themes, methodologies and industries. Computers & industrial engineering, 154, 107133.
Kaur, A., Singh, G., Kukreja, V., Sharma, S., Singh, S., & Yoon, B. (2022). Adaptation of IoT with blockchain in Food Supply Chain Management: An analysis-based review in development, benefits and potential applications. Sensors, 22(21), 8174.
Maroušek, J., Strunecký, O., Kolář, L., Vochozka, M., Kopecký, M., Maroušková, A., … & Cera, E. (2024). Advances in nutrient management make it possible to accelerate biogas production and thus improve the economy of food waste processing. Energy Sources, Part A: Recovery, Utilization, and Environmental Effects, 46(1), 9379-9388.
Bhat, S. A., Huang, N. F., Sofi, I. B., & Sultan, M. (2021). Agriculture-food supply chain management based on blockchain and IoT: a narrative on enterprise blockchain interoperability. Agriculture, 12(1), 40.
Soma, T., Li, B., & Maclaren, V. (2021). An evaluation of a consumer food waste awareness campaign using the motivation opportunity ability framework. Resources, Conservation and Recycling, 168, 105313.
Ada, N., Kazancoglu, Y., Sezer, M. D., Ede-Senturk, C., Ozer, I., & Ram, M. (2021). Analyzing barriers of circular food supply chains and proposing industry 4.0 solutions. Sustainability, 13(12), 6812.
Khanfar, A. A., Iranmanesh, M., Ghobakhloo, M., Senali, M. G., & Fathi, M. (2021). Applications of blockchain technology in sustainable manufacturing and supply chain management: A systematic review. Sustainability, 13(14), 7870.
Hao, X., & Demir, E. (2024). Artificial intelligence in supply chain decision-making: an environmental, social, and governance triggering and technological inhibiting protocol. Journal of Modelling in Management, 19(2), 605-629.
Tchonkouang, R. D., Onyeaka, H., & Nkoutchou, H. (2024). Assessing the vulnerability of food supply chains to climate change-induced disruptions. Science of the Total Environment, 171047.
Horoś, I. K., & Ruppenthal, T. (2021). Avoidance of food waste from a grocery retail store owner’s perspective. Sustainability, 13(2), 550.
Jain, A., Sarsaiya, S., Awasthi, M. K., Singh, R., Rajput, R., Mishra, U. C., … & Shi, J. (2022). Bioenergy and bio-products from bio-waste and its associated modern circular economy: Current research trends, challenges, and future outlooks. Fuel, 307, 121859.
Ranjbari, M., Esfandabadi, Z. S., Quatraro, F., Vatanparast, H., Lam, S. S., Aghbashlo, M., & Tabatabaei, M. (2022). Biomass and organic waste potentials towards implementing circular bioeconomy platforms: A systematic bibliometric analysis. Fuel, 318, 123585.
Sun, X., Dou, Z., Shurson, G. C., & Hu, B. (2024). Bioprocessing to upcycle agro- industrial and food wastes into high-nutritional value animal feed for sustainable food and agriculture systems. Resources, Conservation and Recycling, 201, 107325.
Sahoo, S., Kumar, S., Sivarajah, U., Lim, W. M., Westland, J. C., & Kumar, A. (2024). Blockchain for sustainable supply chain management: trends and ways forward. Electronic Commerce Research, 24(3), 1563-1618.
Acosta Llano, E., Hurmelinna-Laukkanen, P., & Haapanen, L. (2025). Blockchain for the circular economy, implications for public governance. International Journal of Public Sector Management, 38(1), 30-52.
Khan, S. A., Mubarik, M. S., Kusi‐Sarpong, S., Gupta, H., Zaman, S. I., & Mubarik, M. (2022). Blockchain technologies as enablers of supply chain mapping for sustainable supply chains. Business strategy and the environment, 31(8), 3742- 3756.
Rejeb, A., Rejeb, K., Simske, S., & Treiblmaier, H. (2021). Blockchain technologies in logistics and supply chain management: a bibliometric review. Logistics, 5(4), 72.
Saurabh, S., & Dey, K. (2021). Blockchain technology adoption, architecture, and sustainable agri-food supply chains. Journal of Cleaner Production, 284, 124731.
Centobelli, P., Cerchione, R., Del Vecchio, P., Oropallo, E., & Secundo, G. (2022). Blockchain technology for bridging trust, traceability and transparency in circular supply chain. Information & Management, 59(7), 103508.
Kamble, S. S., Gunasekaran, A., Subramanian, N., Ghadge, A., Belhadi, A., & Venkatesh, M. (2023). Blockchain technology’s impact on supply chain integration and sustainable supply chain performance: Evidence from the automotive industry. Annals of Operations Research, 327(1), 575-600.
Haji, M., & Himpel, F. (2024). Building Resilience in Food Security: Sustainable Strategies Post-COVID-19. Sustainability, 16(3), 995.
Agrawal, S., Agrawal, R., Kumar, A., Luthra, S., & Garza-Reyes, J. A. (2024). Can industry 5.0 technologies overcome supply chain disruptions? —a perspective study on pandemics, war, and climate change issues. Operations Management Research, 17(2), 453-468.
Sánchez, M., Ferreira-Santos, P., Gomes-Dias, J. S., Laca, A., & Rocha, C. M. (2025). Cascading recovery of added-value cocoa bean shell fractions through autohydrolysis treatments. Food and Bioprocess Technology, 18(1), 965-978.
Rajaeifar, M. A., Ghadimi, P., Raugei, M., Wu, Y., & Heidrich, O. (2022). Challenges and recent developments in supply and value chains of electric vehicle batteries: A sustainability perspective. Resources, Conservation and Recycling, 180, 106144.
Dong, M., Jiang, M., He, L., Zhang, Z., Gustave, W., Vithanage, M., … & He, F. (2025). Challenges in safe environmental applications of biochar: identifying risks and unintended consequence. Biochar, 7(1), 1-20.
Hamam, M., Chinnici, G., Di Vita, G., Pappalardo, G., Pecorino, B., Maesano, G., & D’Amico, M. (2021). Circular economy models in agro-food systems: A review. Sustainability, 13(6), 3453.
Kim, J., Manna, A., Roy, A., & Moon, I. (2025). Clustered vehicle routing problem for waste collection with smart operational management approaches. International Transactions in Operational Research, 32(2), 863-887.
Krishnan, R., Yen, P., Agarwal, R., Arshinder, K., & Bajada, C. (2021). Collaborative innovation and sustainability in the food supply chain-evidence from farmer producer organisations. Resources, Conservation and Recycling, 168, 105253.
Gionfriddo, G., & Piccaluga, A. M. C. (2025). Creating shared value through open innovation: Insights from the case of Enel industrial plants. Business Ethics, the Environment & Responsibility, 34(1), 137-154.
Varriale, V., Cammarano, A., Michelino, F., & Caputo, M. (2025). Critical analysis of the impact of artificial intelligence integration with cutting-edge technologies for production systems. Journal of Intelligent Manufacturing, 36(1), 61-93.
Dora, M., Kumar, A., Mangla, S. K., Pant, A., & Kamal, M. M. (2022). Critical success factors influencing artificial intelligence adoption in food supply chains. International Journal of Production Research, 60(14), 4621-4640.
Cerchione, R. (2025). Design and evaluation of a blockchain‐based system for increasing customer engagement in circular economy. Corporate Social Responsibility and Environmental Management, 32(1), 160-175.
Gholipour, A., Sadegheih, A., Mostafaeipour, A., & Fakhrzad, M. B. (2024). Designing an optimal multi-objective model for a sustainable closed-loop supply chain: a case study of pomegranate in Iran. Environment, Development and Sustainability, 26(2), 3993-4027.
Siddique, A., Herron, C. B., Wu, B., Melendrez, K. S., Sabillon, L. J., Garner, L. J., … & Morey, A. (2025). Development of predictive classification models and extraction of signature wavelengths for the identification of spoilage in chicken breast fillets during storage using near infrared spectroscopy. Food and Bioprocess Technology, 18(1), 933-941.
Hong, Z., & Xiao, K. (2024). Digital economy structuring for sustainable development: the role of blockchain and artificial intelligence in improving supply chain and reducing negative environmental impacts. Scientific Reports, 14(1), 3912.
Akbari, M., & Hopkins, J. L. (2022). Digital technologies as enablers of supply chain sustainability in an emerging economy. Operations Management Research, 15(3), 689-710.
Khan, S. A. R., Piprani, A. Z., & Yu, Z. (2022). Digital technology and circular economy practices:future of supply chains. Operations Management Research, 15(3), 676-688.
Ameh, B. (2024). Digital tools and AI: Using technology to monitor carbon emissions and waste at each stage of the supply chain, enabling real-time adjustments for sustainability improvements. Int J Sci Res Arch, 13(1), 2741-2754.
Rejeb, A., Rejeb, K., Abdollahi, A., Zailani, S., Iranmanesh, M., & Ghobakhloo, M. (2021). Digitalization in food supply chains: A bibliometric review and key-route main path analysis. Sustainability, 14(1), 83.
Annosi, M. C., Brunetta, F., Bimbo, F., & Kostoula, M. (2021). Digitalization within food supply chains to prevent food waste. Drivers, barriers and collaboration practices. Industrial Marketing Management, 93, 208-220.
Nurgazina, J., Pakdeetrakulwong, U., Moser, T., & Reiner, G. (2021). Distributed ledger technology applications in food supply chains: A review of challenges and future research directions. Sustainability, 13(8), 4206.
Wang, Q., Sun, T., & Li, R. (2025). Does Artificial Intelligence (AI) enhance green economy efficiency? The role of green finance, trade openness, and R&D investment. Humanities and Social Sciences Communications, 12(1), 1-22.
Mehmood, A., Ahmed, S., Viza, E., Bogush, A., & Ayyub, R. M. (2021). Drivers and barriers towards circular economy in agri‐food supply chain: a review. Business Strategy & Development, 4(4), 465-481.
Kittichotsatsawat, Y., Jangkrajarng, V., & Tippayawong, K. Y. (2021). Enhancing coffee supply chain towards sustainable growth with big data and modern agricultural technologies. Sustainability, 13(8), 4593.
Knorr, D., & Augustin, M. A. (2025). Expanding our food supply: underutilized resources and resilient processing technologies. Journal of the Science of Food and Agriculture, 105(2), 735-746.
Chiaraluce, G., Bentivoglio, D., Finco, A., Fiore, M., Contò, F., & Galati, A. (2024). Exploring the role of blockchain technology in modern high-value food supply chains: Global trends and future research directions. Agricultural and Food Economics, 12(1), 6.
Hassoun, A., Prieto, M. A., Carpena, M., Bouzembrak, Y., Marvin, H. J., Pallarés, N., … & Bono, G. (2022). Exploring the role of green and Industry 4.0 technologies in achieving sustainable development goals in food sectors. Food Research International, 162, 112068.
Kamal, H., Le, C. F., Salter, A. M., & Ali, A. (2021). Extraction of protein from food waste: An overview of current status and opportunities. Comprehensive Reviews in Food Science and Food Safety, 20(3), 2455-2475.
Michel, J., Rivas-Arrieta, M. J., Borén, E., Simonin, L., Kennedy, M., & Dupont, C. (2025). Fate of biomass inorganic elements during hydrothermal carbonization: an experimental study on agro-food waste. Biomass Conversion and Biorefinery, 15(1), 845-860.
Nicastro, R., & Carillo, P. (2021). Food loss and waste prevention strategies from farm to fork. Sustainability, 13(10), 5443.
Akkerman, R., & Cruijssen, F. (2024). Food loss, food waste, and sustainability in food supply chains. In Sustainable supply chains: a research-based textbook on operations and strategy (pp. 219-239). Springer International Publishing.
Subedi, D., Paudel, M., Poudel, S., & Koirala, N. (2025). Food safety in developing countries: common foodborne and waterborne illnesses, regulations, organizational structure, and challenges of food safety in the context of Nepal. Food Frontiers, 6(1), 86-123.
Kayikci, Y., Subramanian, N., Dora, M., & Bhatia, M. S. (2022). Food supply chain in the era of Industry 4.0: Blockchain technology implementation opportunities and impediments from the perspective of people, process, performance, and technology. Production planning & control, 33(2-3), 301-321.
Tsegaye, B., Jaiswal, S., & Jaiswal, A. K. (2021). Food waste biorefinery: Pathway towards circular bioeconomy. Foods, 10(6), 1174.
Huang, I. Y., Manning, L., James, K. L., Grigoriadis, V., Millington, A., Wood, V., & Ward, S. (2021). Food waste management: A review of retailers’ business practices and their implications for sustainable value. Journal of Cleaner Production, 285, 125484.
Amicarelli, V., & Bux, C. (2021). Food waste measurement toward a fair, healthy and environmental-friendly food system: a critical review. British Food Journal, 123(8), 2907-2935.
Santagata, R., Ripa, M., Genovese, A., & Ulgiati, S. (2021). Food waste recovery pathways: Challenges and opportunities for an emerging bio-based circular economy. A systematic review and an assessment. Journal of Cleaner Production, 286, 125490.
Powell, W., Foth, M., Cao, S., & Natanelov, V. (2022). Garbage in garbage out: The precarious link between IoT and blockchain in food supply chains. Journal of Industrial Information Integration, 25, 100261
.
Kymäläinen, T., Seisto, A., & Malila, R. (2021). Generation Z food waste, diet and consumption habits: A Finnish social design study with future consumers. Sustainability, 13(4), 2124.
Karimova, G. S., Heidbrink, L., Brinkmann, J., & LeMay, S. A. (2025). Global standards and the philosophy of consumption: Toward a consumer‐driven governance of global value chains. Business Ethics, the Environment & Responsibility, 34(1), 280-294.
Rashid, A., Rasheed, R., & Altay, N. (2025). Greening manufacturing: the role of institutional pressure and collaboration in operational performance. Journal of Manufacturing Technology Management, 36(2), 455-478.
Ratnakar, R. R., Gupta, N., Zhang, K., van Doorne, C., Fesmire, J., Dindoruk, B., & Balakotaiah, V. (2021). Hydrogen supply chain and challenges in large-scale LH2 storage and transportation. International Journal of Hydrogen Energy, 46(47), 24149-24168
Huang, Y., Ghadge, A., & Yates, N. (2024). Implementation of digital twins in the food supply chain: a review and conceptual framework. International Journal of Production Research, 1-27.
Ali, I., & Aboelmaged, M. G. S. (2022). Implementation of supply chain 4.0 in the food and beverage industry: perceived drivers and barriers. International Journal of Productivity and Performance Management, 71(4), 1426-1443.
Ciccullo, F., Cagliano, R., Bartezzaghi, G., & Perego, A. (2021). Implementing the circular economy paradigm in the agri-food supply chain: The role of food waste prevention technologies. Resources, Conservation and Recycling, 164, 105114.
Surucu-Balci, E., & Tuna, O. (2021). Investigating logistics-related food loss drivers: A study on fresh fruit and vegetable supply chain. Journal of Cleaner Production, 318, 128561.
Dauvergne, P. (2022). Is artificial intelligence greening global supply chains? Exposing the political economy of environmental costs. Review of International Political Economy, 29(3), 696-718.
Griffiths, M., & Rubaii, K. (2025). Late modern war and the geos: The ecological ‘beforemaths’ of advanced military technologies. Security Dialogue, 56(1), 38-57.
Rossini, M., Powell, D. J., & Kundu, K. (2023). Lean supply chain management and Industry 4.0: a systematic literature review. International Journal of Lean Six Sigma, 14(2), 253-276.
Eyo-Udo, N. (2024). Leveraging artificial intelligence for enhanced supply chain optimization. Open Access Research Journal of Multidisciplinary Studies, 7(2), 001-015.
Hübner, N., Caspers, J., Coroamă, V. C., & Finkbeiner, M. (2024). Machine‐learning‐based demand forecasting against food waste: Life cycle environmental impacts and benefits of a bakery case study. Journal of Industrial Ecology, 28(5), 1117-1131.
Sharma, M., Joshi, S., Luthra, S., & Kumar, A. (2022). Managing disruptions and risks amidst COVID-19 outbreaks: role of blockchain technology in developing resilient food supply chains. Operations Management Research, 15(1), 268-281.
Yadav, S., Luthra, S., & Garg, D. (2021). Modelling Internet of things (IoT)-driven global sustainability in multi-tier agri-food supply chain under natural epidemic outbreaks. Environmental Science and Pollution Research, 28(13), 16633-16654.
Vilas-Boas, A. A., Pintado, M., & Oliveira, A. L. (2021). Natural bioactive compounds from food waste: Toxicity and safety concerns. Foods, 10(7), 1564.
Wani, N. R., Rather, R. A., Farooq, A., Padder, S. A., Baba, T. R., Sharma, S., … & Ara, S. (2024). New insights in food security and environmental sustainability through waste food management. Environmental Science and Pollution Research, 31(12), 17835-17857.
Kumar, I., Rawat, J., Mohd, N., & Husain, S. (2021). Opportunities of artificial intelligence and machine learning in the food industry. Journal of Food Quality, 2021(1), 4535567.
Jagtap, S., Garcia-Garcia, G., & Rahimifard, S. (2021). Optimisation of the resource efficiency of food manufacturing via the Internet of Things. Computers in Industry, 127, 103397.
Verghese, K., Lewis, H., Lockrey, S., & Williams, H. (2015). Packaging’s role in minimizing food loss and waste across the supply chain. Packaging Technology and Science, 28(7), 603-620.
Nair, C. S., Manoharan, R., Nishanth, D., Subramanian, R., Neumann, E., & Jaleel, A. (2025). Recent advancements in aquaponics with special emphasis on its sustainability. Journal of the World Aquaculture Society, e13116.
Marusak, A., Sadeghiamirshahidi, N., Krejci, C. C., Mittal, A., Beckwith, S., Cantu, J., … & Grimm, J. (2021). Resilient regional food supply chains and rethinking the way forward: Key takeaways from the COVID-19 pandemic. Agricultural Systems, 190, 103101.
Sunaryo, D., Adiyanto, Y., Violita, E., Nabila, F., & Killah, K. E. (2025). Risk Management and Its Influence on Corporate Performance: A Systematic Literature Review Approach.
Lerman, L. V., Benitez, G. B., Müller, J. M., de Sousa, P. R., & Frank, A. G. (2022). Smart green supply chain management: A configurational approach to enhance green performance through digital transformation. Supply Chain Management: An International Journal, 27(7), 147-176.
Etemadi, N., Borbon-Galvez, Y., Strozzi, F., & Etemadi, T. (2021). Supply chain disruption risk management with blockchain: A dynamic literature review. Information, 12(2), 70.
Katsaliaki, K., Galetsi, P., & Kumar, S. (2022). Supply chain disruptions and resilience: A major review and future research agenda. Annals of Operations Research, 1-38.
Lokanan, M. E., & Maddhesia, V. (2025). Supply chain fraud prediction with machine learning and artificial intelligence. International Journal of Production Research, 63(1), 286-313.
Farooq, M. U., Hussain, A., Masood, T., & Habib, M. S. (2021). Supply chain operations management in pandemics: A state-of-the-art review inspired by COVID-19. Sustainability, 13(5), 2504.
Martin-Rios, C., Hofmann, A., & Mackenzie, N. (2020). Sustainability-oriented innovations in food waste management technology. Sustainability, 13(1), 210.
Versino, F., Ortega, F., Monroy, Y., Rivero, S., López, O. V., & García, M. A. (2023). Sustainable and bio-based food packaging: A review on past and current design innovations. Foods, 12(5), 1057.
Anjomshoae, A., Banomyong, R., Hossein Azadnia, A., Kunz, N., & Blome, C. (2025). Sustainable humanitarian supply chains: a systematic literature review and research propositions. Production Planning & Control, 36(3), 357-377.
Dutta, S., He, M., Xiong, X., & Tsang, D. C. (2021). Sustainable management and recycling of food waste anaerobic digestate: a review. Bioresource technology, 341, 125915.
Caliskan, A., Abdullah, N., Ishak, N., Ametefe, D. S., & Caliskan, I. T. (2025). Systematic literature review on the utilization of tuber crop skins in the context of circular agriculture. International Journal of Recycling of Organic Waste in Agriculture, 14(1).
Park, A., & Li, H. (2021). The effect of blockchain technology on supply chain sustainability performances. Sustainability, 13(4), 1726.
Soyler, A., Burmaoglu, S., & Kidak, L. B. (2025). The evolutionary path of medical waste management research: Insights from co-citation and co-word analysis. Waste Management & Research, 43(1), 3-15.
Galanakis, C. M. (2024). The future of food. Foods, 13(4), 506.
Adeusi, K. B., Adegbola, A. E., Amajuoyi, P., Adegbola, M. D., & Benjamin, L. B. (2024). The potential of IoT to transform supply chain management through enhanced connectivity and real-time data. World journal of advanced engineering technology and sciences, 12(1), 145-151.
Stein, A. J., & Santini, F. (2022). The sustainability of “local” food: A review for policy-makers. Review of Agricultural, Food and Environmental Studies, 103(1), 77-89.
Daghighi, A., & Shoushtari, F. (2023). Toward Sustainability of Supply Chain by Applying Blockchain Technology. International journal of industrial engineering and operational research, 5(2), 60-72.
Tabassum, Z., Girdhar, M., Anand, A., Kumari, N., Sood, B., Malik, T., … & Mohan, A. (2025). Trash to treasure: advancing resource efficiency using waste-derived fillers as sustainable reinforcing agents in bioplastics. Materials Advances, 6(2), 527-546.
Brunner, P. H., & Morf, L. S. (2025). Waste to energy, indispensable cornerstone for circular economy: A mini-review. Waste Management & Research, 43(1), 26-38.


You must be logged in to post a comment.