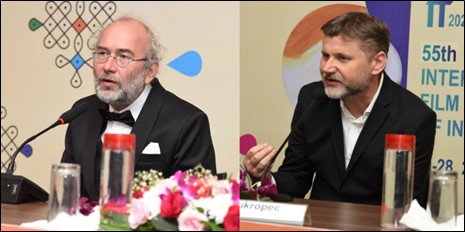
The Press Conference for the much-anticipated closing film ‘Dry Season’ (originally titled Sukho), directed by the acclaimed Bohdan Sláma and produced by Petr Oukropec, was held as part of the 55th International Film Festival of India (IFFI) in Goa. Organized by the Press Information Bureau, the event highlighted the film’s poignant exploration of environmental and generational challenges.
Set amidst verdant fields, the story follows Josef, a fifty-year-old farmer striving for an alternative lifestyle with his wife Eva and their three children. Josef’s clash with Viktor, a profit-driven agribusiness owner, intensifies as a dry summer leaves the village without drinking water, sparking tensions between their families, complicated further by Viktor’s strained bond with his returning son.
Director Bohdan Sláma reflected on the universal bond between humans and the environment, underlining the need to protect natural resources as a reflection of safeguarding the human spirit. He spoke about the meticulous journey of crafting the screenplay, which took three years and underwent 11 revisions, and expressed gratitude for the collaborative efforts of the cast and producers that enriched the filmmaking process.
Producer Petr Oukropec shared the complexities of financing and creating art-house cinema in smaller nations, emphasizing the significance of international collaborations. He lauded the film’s relevance, resonating with global audiences by addressing themes of sustainability, family, and generational divides.
The filmmakers urged younger audiences to take ownership of their future, as the narrative serves as a mirror to pressing contemporary issues. Concluding the session, Bohdan Sláma expressed hope that Dry Season would spark meaningful conversations, not just in India but across the world, reminding audiences of the delicate balance between humanity and nature.
Ministry of Food Processing Industries (MoFPI) is implementing a Centrally Sponsored- “Pradhan Mantri Formalisation of Micro Food Processing Enterprises (PMFME) Scheme” for providing financial, technical and business support for upgradation of micro food processing enterprises in the country. The scheme is operational for a period of five years from 2020-21 to 2025-26 with an outlay of Rs. 10,000 Crore. The scheme aims to enhance the competitiveness of existing individual micro-enterprises in the unorganized segment of the food processing industry and promote formalization of the sector. The Scheme primarily adopts One District One Product (ODOP) approach to reap the benefit of scale in terms of procurement of inputs, availing common services and marketing of products. It provides the framework for value chain development and alignment of support infrastructure. The ODOP are identified by States / UTs based on the agriculture production, raw material availability, perishability of the product etc. The details of financial assistance offered to the prospective entrepreneurs under PMFME Scheme to promote ODOP are at Annexure.
Ministry of Food Processing Industries (MoFPI) extends financial assistance as grant-in-aid to various institutions/ universities, Public funded organizations and recognized R&D laboratories both in public and private sector, to promote and undertake demand driven R&D work in the Food Processing Sector for product and process development, design and development of equipment, improved storage, shelf-life, packaging etc.
Under the scheme, financial assistance as grant-in-aid is given to Private organizations/ Universities/institutions/R&D laboratories and Council of Scientific & Industrial Research (CSIR) recognized R&D units in private sector to the tune of 50% of equipment cost in general areas and 70% in difficult areas and to various Universities, Indian Institute of Technology(IITs), Central/ State Government Institutions, Government funded organizations to promote and undertake demand driven R&D work in food processing sector for product & process development, design and development of equipment, improved storage, shelf-life, packaging etc. R&D projects of Government organizations/ Institutions are eligible for 100% grant-in-aid for the cost of equipment, consumables and expenditure related to Research Fellows, etc. R&D portal had been developed through the National Institute of Food Technology, Entrepreneurship & Management (NIFTEM), Kundli, Sonepat, Haryana to disseminate information relating to research & development work supported by MoFPI scheme, including outcomes, technologies developed, etc. The portal will also be a repository of R&D work by other Ministries/Institutions in the food processing sector.
This information was given by Union Minister of Food Processing Industries Shri Chirag Paswan in a written reply in Lok Sabha today.
ANNEXURE
The details of financial assistance offered to the enterprises under Pradhan Mantri Formalisation of Micro Food Processing Enterprises (PMFME) Scheme are as under:
(i). Support to Individual / Group Category Micro Enterprises: Credit-linked capital subsidy @35% of the eligible project cost, maximum ceiling Rs.10 lakh per unit;
(ii). Support to SHGs for seed capital: Seed capital @ Rs. 40,000/- per member of SHG engaged in food processing for working capital and purchase of small tools subject to maximum of Rs. 4 lakh per SHG Federation.
(iii). Support for Common Infrastructure: Credit linked capital subsidy @35% subject to maximum of Rs. 3 crore to support FPOs, SHGs, Cooperatives and any Government agency for setting up of common infrastructure. The common infrastructure will also be available for other units and public to utilize on hiring basis for substantial part of the capacity.
(iv). Branding and Marketing Support: Grant upto 50% for Branding and Marketing to groups of FPOs/ SHGs/ Cooperatives or an SPV of micro food processing enterprises.
(v). Capacity Building: The scheme envisages training for Entrepreneurship Development Skilling (EDP+): program modified to meet the requirement of food processing industry and product specific skilling.
The Global Nature Conservation Index (NCI) 2024 is brought out recently, for the first time, by Goldman Sonnenfeldt School of Sustainability and Climate Change, Ben-Gurion University of the Negev, Israel and BioDB.com. India has been ranked 176 out of total 180 countries undermining the well-recognized efforts of India in Land Management, Threats to Biodiversity, Capacity & Governance and Climate Change Mitigation. NCI has not taken into account the country reported data in respect of many indicators and relied on many other sources leading to unrealistic NCI index. Further, NCI has completely ignored India’s leadership role in international environmental forums such as International Big Cat Alliance (IBCA), Mission LiFE, International Solar Alliance (ISA) and Coalition for Disaster Resilience Infrastructure (CDRI) advocating for global cooperation on biodiversity conservation as well as its leadership role on global climate change agenda.
In recent years, India has taken several measures in areas of land management and threats to its biodiversity which have not been taken into account while deriving NCI. For example, the Government of India enacted Biological Diversity Act, 2002, as amended by the Biological Diversity (Amendment) Act, 2023 (BD Act) together with new set of Rules to conserve, sustainably use and regulate the access of biological resources and knowledge associated thereto. The Act covers various measures under the provisions of the BD Act to conserve biodiversity including the constitution of Biodiversity Management Committees (BMCs), notification for Biodiversity Heritage Sites and notification for threatened species. The notification confers power to the State Biodiversity Boards (SBBs) for regulating access to the notified species and to take measures to rehabilitate and preserve those species.
Some of India’s key achievements in land management and biodiversity conservation are as follows:
India has 1022 Protected Areas in the country, covering an area of 178,640 sq. km, which is about 5.43 % of the geographical area of the country.
Total Forest Cover has increased from 21.23% in 2013 to 21.71% in 2021 .
India has 72.16 lakh Ha of forest cover as per the FAO’s Global Forest Resource Assessment 2020, securing its place among the top ten countries worldwide.
Eco-Sensitive Zones of 487 Protected Areas have been established across India.
Number of Ramsar sites have increased from 26 in 2014 to 85 in 2024.
There are 55 Tiger Reserves in India and tiger population has increased from 2226 in 2014 to 3682 in 2022.
India’s Project Lion has fostered a growing lion population in the Gir Landscape—from 284 in 1990 to 674 in 2020.
India has reintroduced Cheetah in the Indian habitat through the world’s first inter-continental large wild carnivore translocation project.
With 33 Elephant Reserves, India holds by far the largest number of wild Asian elephants, estimated at about 30,000 or nearly 60% of the population of the species.
India’s leopard population is estimated at 13,874 individuals, representing stable population in comparison to the similar area being sampled in 2018 with 12,852 individuals.
The Namami Gange Programe to rejuvenate River Ganga and its tributaries has been recognised as World Restoration flagship project by UN which reflects the commitments of Government towards conservation, rejuvenation and development of natural ecosystems and its services.
India has already submitted its National Targets under the National Biodiversity Strategy and Action Plans on 10th September, 2024 and also submitted its National Biodiversity Strategy and Action Plan (NBSAP) on 31st October, 2024 on the Convention on Biodiversity Portal during the recently concluded CBD COP at Cali, Colombia. Both the National Biodiversity Targets and the Action Plans are fully aligned with the goals and targets set under the Kunming Montreal Global Diversity Framework (KMGBF). KMGBF is to be implemented in accordance with the national circumstances, priorities and capabilities.
India’s National Biodiversity Strategy and Action Plan (NBSAP) envisages protecting terrestrial and marine areas, restoring degraded ecosystems and reducing biodiversity threats through pollution control as also invasive species management. India emphasizes species conservation, sustainable resource use, wildlife corridors to reduce fragmentation, and community engagement in biodiversity governance.
India has submitted its Long Term Low Emission Development Strategy (LT-LEDS) for reducing GHG emissions to UNFCCC in November 2022 highlighting strategic low-emissions development transitions for the country. The LT-LEDS was prepared in the light of India’s right to an equitable and fair share of the Global Carbon Budget, which is the practical implementation of Climate Justice. The key elements of the strategy include- Low carbon development of electricity systems consistent with development; development of an integrated, efficient, inclusive low-carbon transport system; promoting adaptation in urban design, energy and material-efficiency in buildings and sustainable urbanisation; promoting economy-wide decoupling of growth from emissions and development of an efficient, innovative low-emission industrial system; CO2 removal and related engineering solutions; enhancing forest and vegetation cover consistent with socio-economic and ecological considerations; and developing strategy on economic and financial aspects of low-carbon development. Some of the initiatives include the Smart Cities Mission (SCM), National Action Plan of Climate Change (NAPCC) promoting climate-resilient and sustainable urban development.
The Adaptation Communication submitted to UNFCCC in 2023 outlines the actions taken for adaptation to climate risks and challenges, and future strategy for the same. India has developed an integrated approach, ranging from food security, energy use efficiency, and water management aiming to address these issues simultaneously through appropriate policies and initiatives.
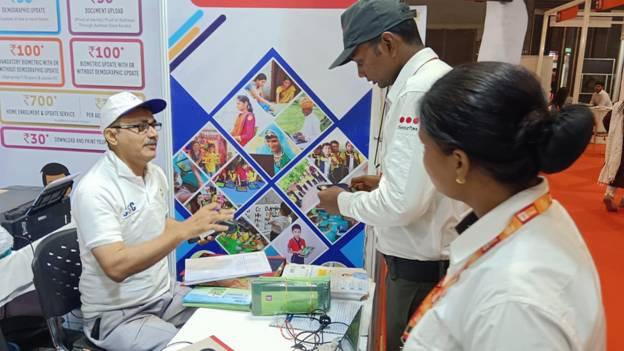
The Ministry of Electronics and Information Technology has set up a vibrant stall at the India International Trade Fair (IITF) in Hall No. 14. Hosted by Common Service Centers (CSC), the stall showcases a wide range of digital and community services, including the Grameen eStore, CSC Academy, DigiPay, Aadhaar-related services, and other key initiatives. The primary aim of this exhibit is to spread awareness about the facilities provided by CSC and encourage more people to leverage these services for their empowerment.
The Dynamic Leaders Behind the Stall
This CSC stall is led by two dedicated and inspiring Village Level Entrepreneurs (VLEs) from Delhi, Siddharth and Vikas. Their dedication and commitment reflect the transformative power of digital services, as they serve their communities while setting examples for others.
Siddharth: A 22-Year-Old Visionary
Siddharth, a 22-year-old entrepreneur, started his CSC center in 2020. Operating from Mandawali, Delhi, he faced the responsibility of supporting his family right after completing his 12th-grade education. Despite the challenges, he turned his situation around by utilizing the income generated through CSC services. Today, Siddharth manages services such as Aadhaar registration, DigiPay, and Grameen eStore with great efficiency. His journey is a testament to how young individuals can transform their lives by seizing the right opportunities.
Vikas: A Story of Resilience and Success
50-year-old Vikas has overcome significant challenges in his life. Stricken by polio in childhood, he experiences difficulty walking. However, his determination never wavered, and he established his CSC center in the Rohini area of Delhi. Vikas’s story serves as a powerful reminder that physical limitations cannot hinder one’s drive and potential for success. Through his center, he provides vital services like Aadhaar enrollment, seamless transactions via DigiPay, and other government schemes.
The CSC Stall: A Symbol of Digital Empowerment
Visitors to the CSC stall at IITF can explore opportunities like the Grameen eStore, which facilitates easy buying and selling of products, DigiPay for cashless transactions, and CSC Academy’s programs to enhance digital literacy. The efforts of VLEs like Siddharth and Vikas underscore how digital services can bridge gaps and empower individuals, even in the face of adversity.
Role Models for Society
The inspiring journeys of Siddharth and Vikas illustrate that digital services are not just tools for livelihood but also a means to uplift every segment of society. Their hard work and dedication have made them role models for countless others aspiring to achieve financial independence and social impact.
The CSC stall at the India International Trade Fair exemplifies the success of the Digital India initiative, reaching even the remotest corners of the country. Siddharth and Vikas, with their resilience and determination, stand as shining examples of this transformation. Their stories teach us that success is achievable despite challenges if one has perseverance and the right opportunities. CSC’s initiative not only promotes digital inclusion but also inspires individuals across the nation to become self-reliant and empowered.
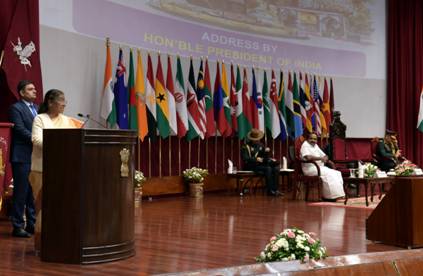
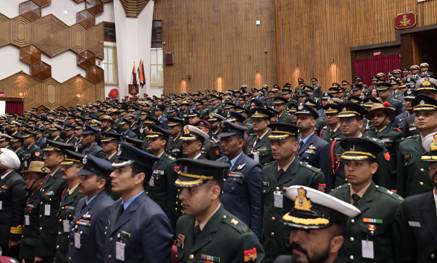
President Smt Droupadi Murmu visited the Defence Services Staff College (DSSC), Wellington in The Nilgiris District, Tamil Nadu on November 28, 2024. Addressing the student officers and faculty, the President said the DSSC has made commendable contribution to training & educating the potential leaders of the Armed Forces of India and friendly countries & selected civilian officers. Over the past seven decades, it has played a major role in professionally grooming the middle level officers. It has the unique distinction of having a composite multi-service and multi-national group of student officers and a professionally enriched faculty.
The President was happy to note that women officers are now commanding various units in all the three services. She said that the increasing strength and role of women in all spheres is encouraging and inspiring for all, especially young girls. She expressed hope for witnessing more and more women joining the Armed Forces, where they can demonstrate exceptional capabilities and break new ground in uncharted territories.
The President said that India is rising and the world is acknowledging the growth in various sectors, including defence. India is moving towards indigenisation and self-reliance to keep the Armed Forces ready to meet the future challenges. The country is being developed as a major defence manufacturing hub, and is moving towards becoming a reliable defence partner & big defence exporter.
The President said: “In the fast-changing geopolitical environment, we need to be well-prepared to tackle any situation. We not only have to secure our national interests, but also prepare for new national security challenges like cyber warfare and terrorism. Updated knowledge and cutting-edge technologies based on intensive research are required to be applied.” She expressed confidence that this course will prepare student officers all for higher responsibilities and as strategists who can deal with complex situations in an effective manner.
The President appreciated the unique role of the institution in nurturing the future senior leadership of the Armed Forces. She appreciated the creativity, dedication and the focus with which training is being conducted at the College. She also complimented the student officers for having being selected for the prestigious Staff Course at DSSC, and their rigourous efforts while undertaking this course.
The President also interacted with the Student Officers, including 38 from friendly countries, attending the course at the DSSC. She hailed the role of the International Student Officers in strengthening the mutual cooperation and relationship of their countries with India, and wished them a fruitful and successful stay at DSSC.
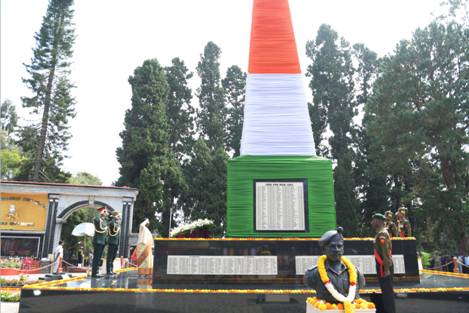
The President also laid a wreath at the War Memorial, and interacted with Ex-servicemen & Veer Naris.
The President felicitated the Veer Naris acknowledging the supreme sacrifice of their loved ones in the service to the Nation. She was accompanied by Minister of Backward Classes (Minister-in-Waiting) of Tamil Nadu Government Shri Siva V Meyyanathan and Commandant DSSC Lt Gen Virendra Vats.
Established in 1948, DSSC is a premier Tri-services institute with a mandate to train and hone their skills of selected middle-level officers of the Armed Forces of India and friendly countries. Since its inception, the College has trained more than 2,000 International Officers, and 24,000 Indian Officers have passed through its portals. The College alumni, over the years, have risen to become heads of States and Militaries across the world. The President appreciated the training activities being conducted at the College with special emphasis on initiatives undertaken on enhancing jointmanship amongst the officers of the Indian Armed Forces.
To protect, promote & preserve various forms of folk art and culture throughout the country, the Government of India has set up seven Zonal Cultural Centres (ZCCs) with headquarters at Patiala, Nagpur, Udaipur, Prayagraj, Kolkata, Dimapur and Thanjavur. Annual grant-in-aid is released to these seven ZCCs for organizing various cultural activities and programmes on regular basis in their member States.
To promote the tribal culture, various festivals like Hornbill Festival, Octave, Tribal Dance Festival, Adi Bimb, Adi Sapta Pallav, Adi Lok Rang, Adiwasi Mahotsav etc. are organized through Zonal Cultural Centres (ZCCs) of Ministry of Culture to showcase unique forms of folk dances, songs, cuisine, exhibitions and demonstration of traditional skill in painting, art & craft etc. Artists are engaged by ZCCs from tribal areas to showcase their talents in various cultural programmes/ activities organized by them for which they are paid honorarium, DA/TA, boarding & lodging etc. The annual grant-in-aid released to the seven ZCCs for organizing various cultural activities and programmes during the last three year is as under:
(Rs. in lakh)
Sl. No.
Year
Amount released
1.
2021-22
6798.08
2.
2022-23
6572.06
3.
2023-24
11967.57(as on 31st March, 2024)
Ministry of Tribal Affairs is implementing the schemes of “Support to Tribal Research Institutes and Tribal Research, Information, Education, Communication and Events” under which various activities are undertaken to conserve and promote tribal culture, archives, artefacts, customs and traditions of the tribal communities.
Under the Scheme of “Tribal Research, Information, Education, Communication and Events (TRI-ECE)”, reputed research Institutes/ Organizations/ Universities have undertaken various research studies/ publication of books/ documentation including audio visual documentaries etc.
Kerala is a member State of South Zone Cultural Centre (SZCC), Thanjavur (an autonomous organization under Ministry of Culture) which regularly organizes cultural activities/ programmes in the State of Kerala, Andhra Pradesh, Telangana, Karnataka, Tamil Nadu, Union Territories of Andaman & Nicobar Islands, Lakshadweep and Puducherry. During the last three (03) years, funds released to SZCC, Thanjavur for organizing cultural activities/ programmes in its member States are as under:
(Rs. in lakh)
Sl. No.
Year
Amount released
1.
2021-22
1640.48
2.
2022-23
994.87
3.
2023-24
2135.39
A list of programmes organized by SZCC, Thanjavur in the State of Kerala during the last three (03) years is as under
The details of the financial and passport related services primarily being provided by the post offices to the customers are attached herewith.
Scheme
Features
Post Office Passport Seva Kendras (POPSK)
Currently, providing the passport services at 442 Post Offices Passport Seva Kendras
Post Office SavingsAccount (POSA)
For regular savings, withdrawals etc.Min. balance – ₹ 500/- and ₹ zero in case of Basic Savings AccountATM / Internet & Mobile Banking Facility / NEFT & RTGSPost office Savings Accounts with India Post Payment Bank account linkage for UPI, IMPS etc.
Recurring Deposit (RD)
Min. instalment (per month): ₹ 100/- and thereafter any amount in the multiple of ₹ 10/-Max. instalment: No limitTerm: 5 Years and extendable for another 5 years
Time Deposit (TD)1/2/3/5 Year(s)
Min. Deposit (Single): ₹ 1000 /- or in the multiple of ₹ 100/-Max. Deposit: No limitIncome Tax exemption for investment in 5 Year TDExtension – Twice after completion of term
MonthlyIncome Scheme (MIS)
For source of monthly incomeMin. Deposit: ₹ 1,000/- or in its multipleMax. Deposit: ₹ 9.0 lakh /- (individual); ₹ 15 lakh (in Joint)Term – 5 Years
Senior Citizens Savings Schemes (SCSS)
Special scheme for Senior CitizensFor source of quarterly incomeMin. Single Deposit: Rs. 1,000/- or in its multipleMax. Deposit: Rs. 30,00,000/-Term – 5 Year and extendable after the expiry of each block period of three years
Public Provident Fund (PPF)
Min. Initial Deposit: ₹ 500/-Max. Deposit: ₹ 1,50,000/- in a Financial YearMin. Subsequent deposit in the multiple of ₹ 50/-Income Tax exemption for investmentTax free InterestTerm – 15 Years and extendable further
Sukanya Samriddhi Yojana Account (SSA)
Special Scheme for girl childrenMin. Initial Deposit: ₹ 250/-Max. Deposit: ₹ 1,50,000/- in a Financial YearMin. Subsequent deposit in the multiple of ₹ 50/-Income Tax exemption for investmentTax free InterestTerm – 21 Years
NationalSavings Certificate – VIII Issue (NSC)
Minimum investment – ₹ 1,000/-Maximum investment: No limit – In multiples of ₹ 100/-Income Tax exemption for investmentTerm – 5 years
Kisan Vikas Patra (KVP)
Minimum investment – ₹ 1,000/-Maximum investment: No limit – In multiples of ₹ 100/-Maturity – Double the amount of investment
Mahila Samman Savings Certificate (MSSC)
Special Scheme for Women and girl childrenInvestment is allowed from 01.04.2023 to 31.03.2025Minimum investment – ₹ 1,000/-Maximum investment: ₹ 2 Lakh per individual – In multiples of ₹ 100/-3 months-time-gap between the opening of accountsTerm – Two yearsLockup period – 6 months
PM Cares for Children Scheme 2021
Special scheme for the beneficiaries identified by Ministry of Women and Child DevelopmentInitially, 4515 accounts were opened and fundedInvestment differs based on the age of child and maturity amount is ₹10 LakhMIS Interest is payable on 10 Lakh from the age of 18 to 23Maturity at the age of 23 of the account holders.
India Post Payment Bank (IPPB)
Savings and current accounts Virtual Debit Card Domestic Money Transfer services Bill and utility payments Insurance services for IPPB customers
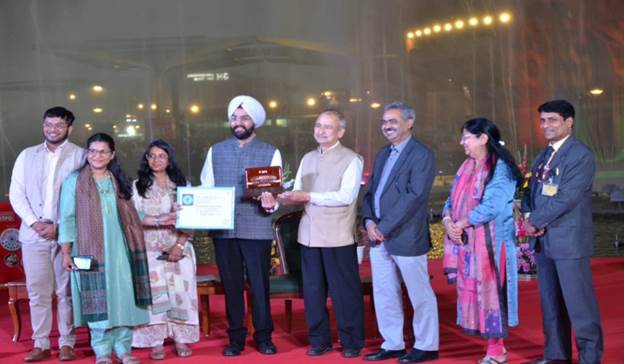
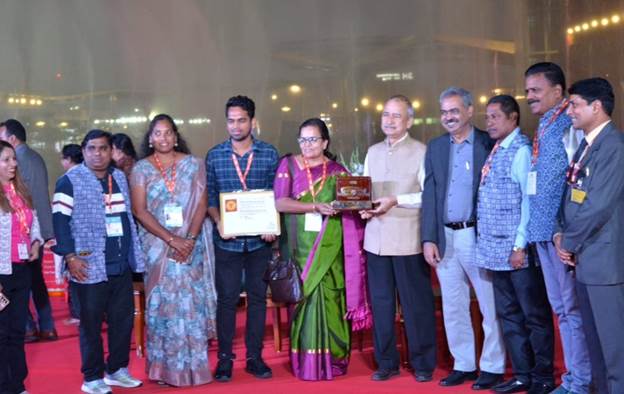
On the concluding day of November 27, 2024, the curtains fell on the historic 43rd edition of the India International Trade Fair (IITF). Shri Premjit Lal, ED, ITPO announced that this year a good amount of business was generated by the participants. He indicated that more than one million visitors witnessed the fair. He praised the media for their wide coverage not only in print media but social media too.
Puducherry won the Gold Medal, the Silver Medal was presented to Meghalaya and the Bronze Medal to Karnataka in the States and Union Territories Category, Special Appreciation Certificates was also conferred to Punjab, West Bengal and Tripura.
In the Thematic Presentation by the States Category, Madhya Pradesh won the Gold Medal, the Silver Medal was presented to Odisha and Bronze to Assam. Special Appreciation Certificates were also given to Maharashtra, Punjab and Tamil Nadu.
At IITF, the ITPO also observed and celebrated Swachh Bharat Abhiyaan, raising awareness about cleanliness and sanitation among exhibitors and visitors and the award was also given to Swachh Pavilion – Gold to Goa, Silver to Kerala, Bronze to Haryana and Commendation was also awarded to Uttarakhand and Gujarat.
In the Foreign Pavilions, the Embassy of the Republic of Tunisia was commended with the Gold Medal and Egypt (Milano Bazar) won the Silver while the Bronze Medal was presented to Turkey, Tillo Hediyelik Eşya Sanayi tic itet Ltd. Serketi and Thailand (Thai SMEs Exporter Association).
In the Ministries and Departments, PSUs, PSB and Commodity Boards category, Reserve Bank of India bagged the Gold Medal, Punjab National Bank (PNB), received the Silver Medal respectively, while State Bank of India (SBI) won the Bronze Medal. Special Appreciation Certificates were received by the Coal India Limited and Central Bank of India.
In the Empowering India (Ministries & Govt. Department/SARAS/KVIC/Min. of Social Justice), the Gold Medal was conferred to Ministry of Rural Development (SARAS), the Silver Medal to Khadi and Village Industries Commission (KVIC), Ministry of Micro, Small and Medium Enterprises (MSME) and Ministry of Panchayati Raj bagged the Bronze Medal. Special Commendation was awarded Pt. Deendayal Upadhyaya Institute for Persons with Physical Disability and Department for Promotion of Industry and Internal Trade (DPIIT) and NHDC-National Handloom Development Corporation (NHDC)
In the Private Sector, Jina Ranjit and Sons LLP won the Gold Medal, The Supreme Industries Limited (Supreme Furniture) received the Silver Medal and Ananda Dairy Limited bagged the Bronze Medal. Special Commendation was awarded to Mittal Electronics (Sujata), Hamdard Foods India and Romana Herbal Care Pvt. Ltd. (Rosa, Hychating Mist).
Complimenting all the Award winners in different categories, Shri Premjit Lal appreciated the participants and visitors for their continued faith in the IITF format. He also appreciated Delhi Police and other law enforcement agencies for their continued efforts in making the event incident free.ITPO also conferred awards to exhibitors in different categories.
Red Planet Day is an annual event celebrated on November 28 to honor the fascinating planet Mars, often referred to as the “Red Planet” due to its reddish appearance caused by iron oxide (rust) on its surface. The day is an opportunity to reflect on humanity’s interest in Mars, its exploration, and the ongoing research that helps us understand its potential to support life.
Why November 28?
Red Planet Day marks the anniversary of the launch of Mariner 4, NASA’s first successful mission to Mars. On November 28, 1964, Mariner 4 was launched, and it became the first spacecraft to send back close-up images of the Martian surface, providing humanity with its first glimpse of the planet beyond telescopic observations. These images revealed a barren, cratered landscape, shattering some of the earlier misconceptions about Mars, such as the idea that it harbored canals built by intelligent life.
Mars: The Red Planet
Mars has been a subject of fascination for astronomers and science fiction writers for centuries. It is the fourth planet from the Sun and, like Earth, it has seasons, polar ice caps, and weather patterns. However, Mars differs significantly from Earth in its environment and atmospheric conditions.
Mars has:
A thin atmosphere, mostly carbon dioxide, which offers little protection from the harsh solar radiation.
The largest volcano in the solar system, Olympus Mons, which stands nearly three times the height of Mount Everest.
The longest canyon, Valles Marineris, stretching over 4,000 km, which dwarfs the Grand Canyon.
Evidence of past water flows, with dried riverbeds and ancient lake basins suggesting that liquid water may have once existed on its surface.
Despite its inhospitable surface, Mars remains one of the most studied planets in our solar system because of its potential for past life and its suitability for future human exploration.
The History of Mars Exploration
Over the decades, various space missions have explored Mars, and each has revealed new secrets about the planet. Here are a few key milestones:
Mariner 4 (1964) – As mentioned, it was the first spacecraft to send back images of Mars, proving that the planet was not as Earth-like as once believed.
Viking Program (1976) – NASA’s Viking 1 and Viking 2 orbiters and landers provided crucial data about the Martian atmosphere, surface, and geology, as well as the first in-depth studies of its potential for supporting life.
Mars Rovers – In the 21st century, rovers such as Spirit, Opportunity, Curiosity, and Perseverance have landed on Mars to explore its surface, conduct experiments, and search for signs of past life. Perseverance, which landed in February 2021, is tasked with collecting rock samples that could one day be returned to Earth.
Mars Helicopter Ingenuity – As part of the Perseverance mission, the small helicopter Ingenuity made history in 2021 by becoming the first powered flight on another planet. It successfully flew on Mars, providing aerial reconnaissance for scientific studies.
Why Celebrate Red Planet Day?
Red Planet Day serves multiple purposes:
Education: It’s an opportunity to educate people of all ages about Mars, its exploration, and what we’ve learned from it. Schools, observatories, and museums often host special events or activities focused on Mars-related science and space exploration.
Inspiration: Mars continues to inspire the imagination of people around the world. Celebrating the day can ignite curiosity about space and foster a sense of wonder about our universe.
Scientific Advancement: As new missions to Mars are planned, including NASA’s Artemis Program aiming to return humans to the Moon and eventually send astronauts to Mars, Red Planet Day reminds us of the long-term goals of space exploration and the scientific advancements being made in the process.
Future Exploration: Red Planet Day is also an opportunity to look forward to the future of Mars exploration, especially as private companies like SpaceX and governmental agencies like NASA are working towards the goal of human missions to Mars, potentially establishing the first human colony on another planet.
How Is Red Planet Day Celebrated?
While it is not a widely recognized holiday in the same way as some other observances, space enthusiasts, astronomers, and scientists mark Red Planet Day in various ways:
Public Events: Some observatories and space museums host special exhibits, workshops, and presentations about Mars exploration.
Social Media Campaigns: On Red Planet Day, many space organizations, including NASA and SpaceX, share information, updates, and fun facts about Mars on their social media platforms.
Stargazing: Many amateur astronomers take the opportunity to observe Mars with telescopes, especially when the planet is in close proximity to Earth during opposition (when Earth is directly between Mars and the Sun).
Educational Outreach: Schools and universities might engage in special lessons or activities centered on Mars, its exploration, and space science.
The Future of Mars Exploration
The future of Mars exploration is incredibly exciting. Several planned missions aim to further unravel the mysteries of Mars and explore its potential for human settlement:
NASA’s Mars Sample Return Mission: In collaboration with the European Space Agency (ESA), NASA aims to bring Martian soil samples back to Earth by the late 2020s or early 2030s.
SpaceX’s Starship Missions: SpaceX is developing the Starship vehicle with the goal of sending humans to Mars. Elon Musk’s vision is to eventually establish a sustainable human presence on Mars, potentially as soon as the 2020s or 2030s.
Colonization: While still a long way off, there are ongoing discussions about establishing permanent human colonies on Mars. These would require advanced technologies for life support, food production, and protection from radiation.
Conclusion
Red Planet Day is not only a celebration of the Mariner 4 mission but also a reminder of our collective curiosity and ambition to explore Mars. As we continue to explore and learn about Mars, the planet holds promise as a stepping stone for humanity’s future in space. Whether through scientific discoveries, technological innovations, or inspiring the next generation of explorers, Red Planet Day is a chance to celebrate humanity’s ongoing journey to the stars.
Media plays a crucial role in shaping public perceptions and disseminating information, including scientific knowledge, to the general populace. However, while media has the potential to foster scientific thinking among newspaper readers, it also faces several challenges that can hinder its effectiveness in achieving this goal.
On the positive side, media can serve as a powerful tool for popularizing scientific concepts, discoveries, and advancements. Well-written articles and features in newspapers have the potential to simplify complex scientific subjects, making them accessible to a wider audience. Through engaging storytelling and relatable examples, media can bridge the gap between scientific jargon and public understanding, fostering a sense of curiosity and interest in science.
Furthermore, media coverage can help shed light on critical scientific issues such as climate change, public health concerns, and technological innovations. By presenting accurate and balanced information, media can elevate public awareness and prompt informed discussions, which are vital for making informed decisions at both individual and societal levels.
However, there are challenges that media encounters in effectively spreading scientific thinking. One significant concern is the oversimplification or sensationalization of scientific news for the sake of grabbing attention. This can lead to the distortion of scientific facts and misrepresentation of research findings, which in turn undermines the credibility of scientific information.
Additionally, the competition for readership and the need for high click-through rates in the digital age can encourage the prioritization of sensational stories over in-depth, accurate reporting. This can result in the neglect of more complex scientific issues that require nuanced understanding and analysis.
Furthermore, the lack of scientific literacy among journalists can contribute to inaccurate reporting. Misinterpretation of scientific studies or failure to critically evaluate the credibility of sources can perpetuate misinformation, leading to a misinformed public.
In conclusion, media has the potential to be a powerful agent for spreading scientific thinking among newspaper readers. However, responsible journalism, accurate reporting, and a commitment to presenting science comprehensibly and unbiasedly are crucial for media to effectively fulfil this role. Balancing the demands of generating attention-grabbing content with the responsibility of promoting accurate scientific knowledge is essential for fostering a scientifically informed society.
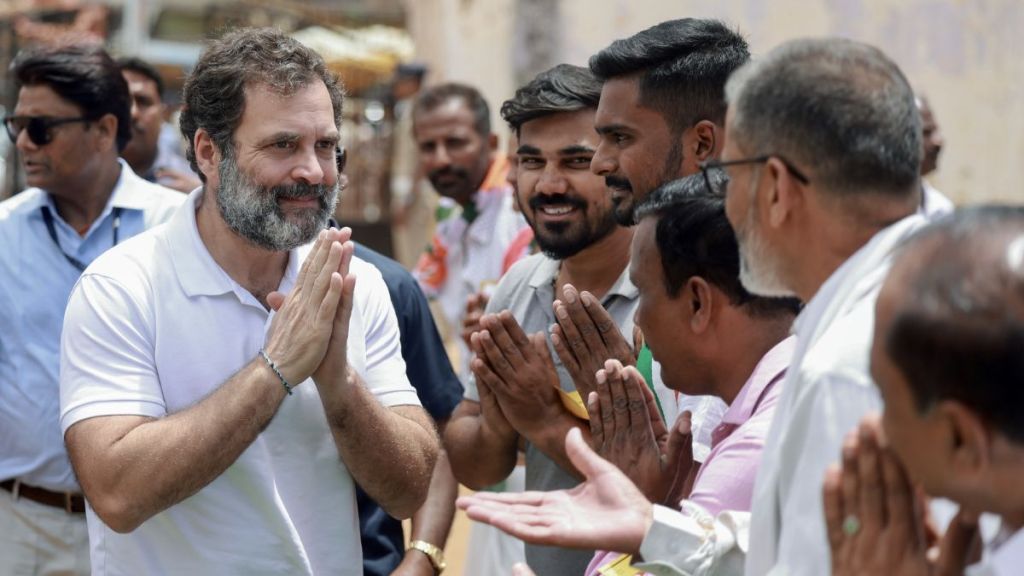
Demography, encompassing factors like age, caste, and religion, influences voting patterns in Karnataka state elections. Understanding the composition of the electorate helps analyze alliances and voting behavior. Rahul Gandhi, a prominent politician from the Indian National Congress, has campaigned in Karnataka and sought to mobilize support for his party. His effectiveness in connecting with voters and influencing the election outcome varies, as it depends on multiple factors beyond an individual’s influence. Other dynamics, such as party strategies, local issues, and the performance of rival parties, also play crucial roles in determining the results of Karnataka state elections.
Demography plays a significant role in elections as it involves the study of population characteristics and their influence on political outcomes. In the context of the Karnataka state election results, demography can provide insights into the composition of the electorate, such as age, gender, caste, and religion, which can shape voting patterns and alliances. Rahul Gandhi is a prominent Indian politician and a member of the Indian National Congress party. His role in the Karnataka state election results would depend on various factors, including his party’s performance, his campaign efforts, and his ability to connect with voters. While he may have campaigned in the state and tried to mobilize support for his party, the overall outcome of the election would depend on multiple factors beyond any individual’s influence.
Changing Demography of Karnataka
Karnataka has experienced significant demographic changes in recent years. The state’s population has been growing steadily, primarily due to natural increase and in-migration from other parts of India. According to the 2011 census, Karnataka had a population of approximately 61 million. Urbanization has been a prominent trend in the state, with cities like Bengaluru, Mysore, and Mangalore witnessing rapid growth. Bengaluru, in particular, has emerged as a major IT and technology hub, attracting professionals from different parts of the country. This influx of migrants has contributed to the cosmopolitan nature of the city. Karnataka is linguistically diverse, with Kannada being the primary language spoken by a majority of the population. However, there are also significant populations that speak other languages such as Tamil, Telugu, Urdu, and Konkani, among others. In terms of religious composition, Hinduism is the predominant religion in Karnataka, followed by Islam, Christianity, and Jainism. The state is also home to various religious sects and communities, contributing to its religious diversity. Caste continues to be a factor influencing Karnataka’s demography and politics. Historically influential communities, such as the Lingayats and Vokkaligas, have played significant roles in the state’s social and political landscape. However, other communities, including Scheduled Castes (Dalits) and Scheduled Tribes, have also gained political representation and influence.
It’s important to note that the demographic landscape of Karnataka may have evolved since my last update. For the most up-to-date and precise information, referring to recent studies and official data sources is recommended.
Emergence of Rahul Gandhi
Rahul Gandhi is a prominent Indian politician and a member of the Indian National Congress party. He is the son of former Indian Prime Minister Rajiv Gandhi and the grandson of former Prime Minister Indira Gandhi. Rahul Gandhi’s emergence as a political figure in India began with his active involvement in the Indian National Congress party and his eventual entry into electoral politics. Rahul Gandhi initially served as a general secretary of the Indian National Congress, working behind the scenes to strengthen the party’s organization and support its electoral campaigns. Over time, he took on a more prominent role within the party, becoming the vice president in 2013 and eventually the president of the Indian National Congress in 2017. Rahul Gandhi’s emergence as a political leader has been characterized by efforts to connect with the youth, marginalized communities, and rural populations. He has advocated for issues such as social justice, inclusivity, and economic development. Rahul Gandhi has campaigned extensively in various state elections, including Karnataka, and has sought to rally support for his party’s candidates. While Rahul Gandhi has garnered a considerable following and support within the Indian National Congress party, his political journey has seen ups and downs. He has faced criticism and scrutiny from political opponents and has been actively involved in debates and discussions on various national and regional issues. It is worth noting that political dynamics and individual influence can vary over time, and the specific impact and future trajectory of Rahul Gandhi’s emergence in Indian politics will continue to evolve as political landscapes change.
History of Karnataka Elections
The history of Karnataka elections dates back to the formation of the state in 1956. Since then, Karnataka has witnessed numerous state assembly elections as well as Lok Sabha (parliamentary) elections. Here is a brief overview of the history of Karnataka elections: Early Years: The first general elections in Karnataka took place in 1957. The Indian National Congress (INC) dominated the political landscape in the early years, winning the majority of seats in the state assembly. Coalition Politics: In the 1980s and 1990s, Karnataka witnessed the rise of coalition politics. The Janata Party, a coalition of various anti-Congress parties, came to power in 1983, marking a shift from single-party dominance. This period saw multiple governments being formed by different alliances, including the Janata Dal and Bharatiya Janata Party (BJP). Rise of the BJP: The Bharatiya Janata Party (BJP) gained prominence in Karnataka during the late 1990s and early 2000s. In 2004, the BJP formed its first government in the state, led by Chief Minister B.S. Yeddyurappa. However, the government faced internal issues, leading to its collapse. Congress Revival: The Indian National Congress made a comeback in Karnataka politics, winning the state assembly elections in 2013. Siddaramaiah became the Chief Minister, leading a Congress government. However, in the 2018 elections, the Congress was unable to secure a majority, leading to a coalition government with the Janata Dal (Secular) party.
Recent Elections: In the most recent state assembly elections held in 2018, the BJP emerged as the single largest party. After a period of political uncertainty, the BJP formed the government with B.S. Yeddyurappa as the Chief Minister. However, in subsequent by-elections, the BJP lost a few seats, resulting in a change of Chief Minister with B.S. Yediyurappa resigning and Basavaraj Bommai taking office in 2021. It’s important to note that the political landscape in Karnataka has been dynamic, with various parties and alliances vying for power. State elections in Karnataka have seen the emergence of regional parties, coalition governments, and shifts in power between the Indian National Congress and the Bharatiya Janata Party. The outcome of elections in Karnataka has had implications for state governance as well as national politics.
New Challenges for Congress Party
The Congress Party in India has faced several challenges in recent years. Here are some of the key challenges it has encountered:
Electoral Performance: The Congress Party has witnessed a decline in its electoral performance, especially in national elections. In the 2014 and 2019 Lok Sabha elections, the party faced significant setbacks, winning only a limited number of seats. This decline has impacted its overall political influence and ability to form a government at the national level.
Leadership Crisis: The party has grappled with a leadership crisis, with a lack of clear and dynamic leadership. This has resulted in a leadership vacuum and internal factionalism, which have weakened the party’s ability to present a united front and effectively communicate its message to the electorate.
Ideological Positioning: The Congress Party has faced challenges in clearly articulating its ideological positioning. In recent years, there has been a growing trend of political parties aligning themselves with specific ideologies or issues, while the Congress Party has struggled to define and communicate its distinct ideological stance.
Regional Strongholds: The Congress Party has lost ground in many states where it previously had strongholds. Regional parties have gained prominence and appeal, leading to a fragmentation of the political landscape. This has reduced the Congress Party’s ability to form alliances and consolidate its support base.
Youth Appeal: The Congress Party has faced difficulties in appealing to the aspirations and concerns of the younger generation. It has struggled to connect with the youth, who are increasingly looking for dynamic and transformative leadership and policies.
Communication Strategy: The Congress Party has faced challenges in effectively communicating its policies and achievements to the electorate. It has struggled to counter the narrative of its political opponents and has often been perceived as lacking a robust communication strategy.
Organizational Strength: The Congress Party has faced issues with its organizational strength and grassroots presence. It has struggled to rejuvenate its party structure and mobilize workers effectively, particularly at the local level.
To overcome these challenges, the Congress Party needs to undertake significant introspection, revitalize its leadership, redefine its ideological positioning, and strengthen its organizational structure. It must also focus on engaging with the aspirations of the youth and effectively communicate its policies and vision to regain public trust and support.
Concluding Remarks
The Congress Party’s performance in Karnataka elections has been subject to critical appraisal due to a mix of successes and failures. While the party has experienced some notable achievements, it has also encountered significant setbacks. Here is a critical appraisal of the Congress Party’s performance in Karnataka elections:
Mixed Electoral Performance: The Congress Party has had mixed electoral performances in Karnataka. It won the state assembly elections in 2013, forming the government under the leadership of Siddaramaiah. However, in the subsequent 2018 elections, the party failed to secure a majority and had to form a coalition government with the Janata Dal (Secular) party. This highlighted a lack of sustained popularity and the inability to secure a clear mandate.
Leadership Challenges: The Congress Party has struggled with leadership challenges in Karnataka. While Siddaramaiah played a significant role in the party’s victory in 2013, his tenure as Chief Minister was marked by controversies and internal rifts. Additionally, the absence of a strong and decisive leader at the state level has affected the party’s ability to effectively mobilize support and present a cohesive image.
Intra-party Factionalism: The Congress Party in Karnataka has been plagued by factionalism and infighting. Internal divisions and power struggles have hindered the party’s unity and cohesion, leading to weakened electoral campaigns and suboptimal coordination among party members.
Failure to Capitalize on Governance: The Congress Party’s tenure in Karnataka witnessed a mixed record in governance. While some initiatives were undertaken, such as social welfare programs and measures to address agrarian issues, the party failed to effectively communicate and capitalize on these achievements. Inadequate implementation and a lack of clear messaging hindered their ability to connect with voters and secure their trust.
Inability to Counter BJP’s Rise: The Congress Party has struggled to counter the Bharatiya Janata Party’s (BJP) rise in Karnataka. The BJP’s strong organizational structure, effective campaign strategies, and appeal to Hindutva ideology have posed significant challenges for the Congress Party. The party has been unable to effectively counter the BJP’s messaging and address the concerns of a changing electorate.
Failure to Strengthen Party Organization: The Congress Party has faced challenges in strengthening its party organization at the grassroots level in Karnataka. The absence of a robust and well-connected organizational structure has hindered their ability to mobilize support and build a strong voter base.
To improve their performance in national elections, the Congress Party needs to address these critical issues. They should focus on nurturing strong and decisive leadership, resolving internal factionalism, communicating their achievements effectively, countering the BJP’s rise, and revitalizing the party organization at all levels. Additionally, connecting with voters on issues that resonate with them and presenting a clear vision for the state’s development will be crucial in rebuilding public trust and support.
References
Antil, A., & Verma, H. V. (2021). Rahul Gandhi on Twitter: An analysis of brand building through Twitter by the leader of the main opposition party in India. Global Business Review, 22(5), 1258-1275.
Devi, B. U. (2013). Rahul Gandhi’s Immaturity. Economic and Political Weekly, 48(43), 5-5.
Gould, H. A. (1997). General Elections, 1996: Karnataka: Decline and Fall of the Congress Machine. Economic and Political Weekly, 2335-2349.
Manor, J. (2008). Letting a winnable election slip away: Congress in Karnataka. Economic and Political Weekly, 23-28.
Mahapatra, S., & Plagemann, J. (2019). Polarisation and politicisation: the social media strategies of Indian political parties.
Manor, J. (2013). Lucky in Its Adversaries: A Slipshod Congress Gains a Majority in the Karnataka Election. Economic and Political Weekly, 51-59.
Palshikar, S., & Suri, K. C. (2014). India’s 2014 Lok Sabha elections: Critical shifts in the long term, caution in the short term. Economic and Political Weekly, 39-49.
Pinto, A. (1994). Karnataka Assembly Elections: An Overview. Economic and Political Weekly, 3309-3311.
Shastri, S. (2009). Leadership at the state level mattered. Economic and Political Weekly, 88-91.
Shastri, S. (2013). The 2013 Karnataka Assembly Outcome: Government Performance and Party Organization Matters. Studies in Indian Politics, 1(2), 135-152.Simmons, C. (2019). Dynastic Continuity and Election in Contemporary Karnataka Politics. In South Asian Sovereignty (pp. 136-149). Routledge India.
The Union Cabinet, chaired by the Prime Minister Shri Narendra Modi, has approved the continuation of its flagship initiative, the Atal Innovation Mission (AIM), under the aegis of NITI Aayog, with an enhanced scope of work and an allocated budget of Rs.2,750 crore for the period till March 31, 2028.
AIM 2.0 is a step towards Viksit Bharat that aims to expand, strengthen, and deepen India’s already vibrant innovation and entrepreneurship ecosystem.
The approval underscores the government’s commitment to fostering a robust innovation and entrepreneurship ecosystem in India. With India at rank 39 on the Global Innovation Index and home to world’s third-largest start-up ecosystem, the next phase of Atal Innovation Mission (AIM 2.0) is expected to further enhance India’s global competitiveness. The continuation of AIM will directly contribute to creating better jobs, innovative products, and high-impact services across sectors.
While building on the accomplishments of AIM 1.0, such as Atal Tinkering Labs (ATL) and Atal Incubation Centers (AIC), AIM 2.0 marks a qualitative shift in the mission’s approach. Whereas AIM 1.0 involved implementing programs that built new innovation infrastructure to strengthen India’s then nascent ecosystem, AIM 2.0 involves piloting new initiatives designed to fill gaps in the ecosystem and scaling successes through central and state governments, industry, academia and community.
AIM 2.0 is designed to strengthen India’s innovation and entrepreneurship ecosystem in three ways: (a) by increasing input (i.e., ushering more innovators and entrepreneurs), (b) by improving the success rate or ‘throughput’ (i.e., helping more startups succeed) and (c) by improving the quality of ‘output’ (i.e., producing better jobs, products and services).
Two programs target increasing input to the ecosystem:
The Language Inclusive Program of Innovation (LIPI) to build innovation and entrepreneurship ecosystems in India’s 22 scheduled languages for lowering entry barrier confronting innovators, entrepreneurs and investors who don’t speak English. 30 Vernacular Innovation Centers will be established in existing incubators.
The Frontier Program to create customized templates for the innovation and entrepreneurship ecosystems of Jammu and Kashmir (J&K), Ladakh, the North Eastern states (NE), Aspirational Districts and Blocks where 15% of India’s citizens live. 2500 new ATLs will be created for template development.
Four programs target improving the throughput of the ecosystem:
The Human Capital Development Program to create a system for producing professionals (managers, teachers, trainers) to build, operate, and maintain India’s innovation and entrepreneurship ecosystem. The pilot will produce 5500 such professionals.
The Deeptech Reactor to create a research sandbox for testing ways of commercializing research-based deep tech startups that require significantly longer time and deeper investment to get to market. Minimum 1 Deeptech Reactor will be piloted.
The State Innovation Mission (SIM) to assist states/UTs with building a strong innovation and entrepreneurship ecosystem that focuses on their areas of strength. SIM will be a component of the NITI Aayog’s State Support Mission.
The International Innovation Collaborations program to take India’s innovation and entrepreneurship ecosystem international. Four areas of intervention are identified: (a) an Annual Global Tinkering Olympiad (b) creation of 10 Bi-lateral, multilateral engagements with advanced nations (c) as a knowledge partner, helping the United Nation’s World Intellectual Property Organization (WIPO) spread the models of AIM and its programs (ATL, AIC) to the countries of the global south, and (d) anchoring the Startup20 Engagement Group of the G20 for India.
Two programs target improving the quality of output (jobs, products, and services):
The Industrial Accelerator program to increase industry involvement in scaling-up advanced startups. Minimum 10 Industry Accelerators in critical sectors will be created in Public Private Partnership (PPP) mode.
The Atal Sectoral Innovation Launchpads (ASIL) program to build iDEX-like platforms in central ministries for integrating and procuring from startups in key industry sectors. Minimum 10 launchpads will be built across key ministries.
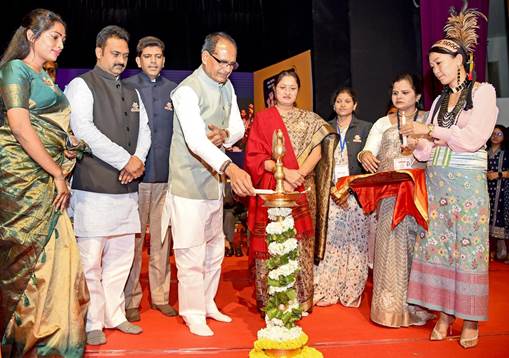
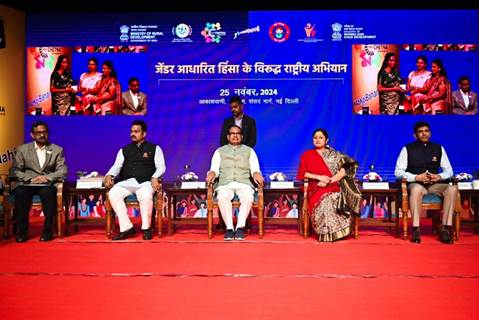
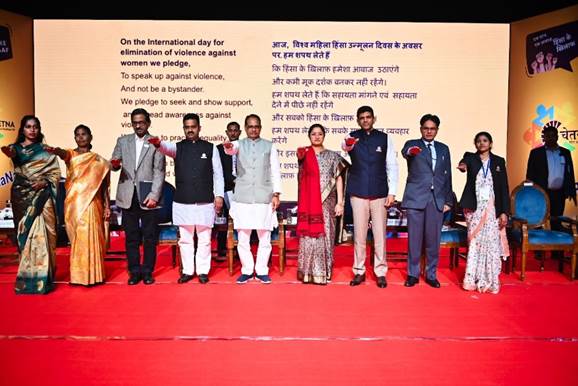
A National Campaign “#AbKoiBahanaNahi” was launched today in New Delhi. It is a collaborative effort between the Ministries of Women and Child Development and Rural Development, with support from UN Women. The Union Minister for Women and Child Development, Smt. Annpurna Devi, Union Minister for Rural Development, Shri Shivraj Singh Chouhan, Minister of State for Rural Development Shri Kamlesh Paswan and Dr. Chandra Sekhar Pemmasani, Minister of State for Rural Development and Communications were present on this occasion.
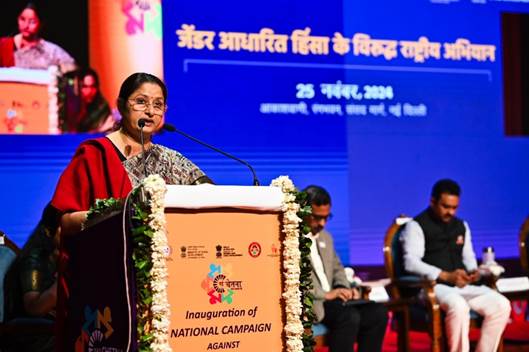
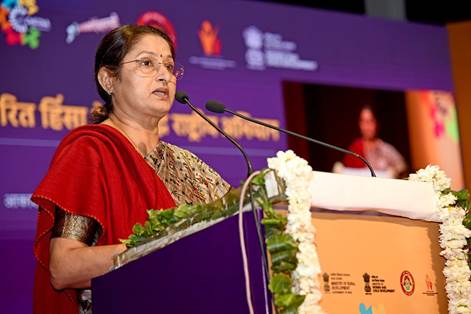
While addressing the gathering the Minister Smt. Annpurna Devi said that the purpose of this campaign being launched today is to advance the rights of women and individuals of diverse genders, and to free their lives from fear and gender-based discrimination. This aims to empower women to break free from shame and societal constraints, enabling them to report the atrocities they have faced and fight for their dignity.
This year, building on the Global Campaign of the United Nations of #NoExcuse, which draws attention to the alarming escalation of violence against women to revitalize commitments, call for accountability and action, the Government of India launched #AbKoiBahanaNahi with the aim to highlight the message of urgency of ending violence against women and girls, and underscoring zero-tolerance stance of central India towards any and all forms of gender-based violence.
The Government of India, implementing the paradigm shift in governance to women-led development, has created enabling provisions for women’s full, equal and meaningful participation in all spheres of life and the economy, such as several large scale interventions to reduce women’s drudgery and poverty, building public care infrastructure and universal access to healthcare, to reduce women’s disproportionate care work, improving access to formal financial systems, bridging the gender digital divide, ensuring safe mobility, safe accommodation, and building a robust service delivery infrastructure for the prevention and redressal of all forms of violence against women and girls.
Highlighting the good work already underway the Union Minister for Rural Development, Shri Shivraj Singh Chouhan, said that if women are to be completely empowered, then women empowerment, social empowerment, political empowerment, and educational empowerment must be achieved. Under the leadership of Prime Minister Shri Narendra Modi, women empowerment initiatives are being implemented as a campaign.
Gender-based violence inhibits women and girls from living with dignity and contributing as equal partners in the development process. As India aims to become a developed country by 2047, under the visionary leadership of Prime Minister Shri Narendra Modi, this dream will not be possible without women’s full and equal contribution, which, in turn, is hindered if women continue to face violence or the threat of violence. The Union Minister for Women and Child Development reiterated the importance of female participation in the economy to make Viksit Bharat, as envisioned by Prime Minister, a reality.
Hence, in order to urge all stakeholders to take decisive steps towards addressing violence against women and girls, the “#AbKoiBahanaNahi” (#अबकोईबहानानहीं) campaign commenced with a national Call to Action. To ensure a wide reach on spreading the call to action on ending gender-based violence, leaving no one behind, the campaign was launched in conjunction with the ‘Nayi Chetna 3.0 campaign,’ organized by the Ministry of Rural Development, reaffirming the national commitment to end all forms of gender-based violence.
At the launch event, a film on #AbKoiBahanaNahi was showcased, highlighting the need for accountability from all stakeholders, including citizens, to pledge against ending gender-based violence.
The primary objective of the campaign is to foster advocacy efforts and inform policy directives concerning the safety and security of women and girls. Furthermore, this campaign serves as a critical and urgent call for systemic change, emphasizing the imperative for justice, equity, and transformation. The campaign aims to catalyze a ripple effect, where each action and initiative contributes to reinforcing the message of women’s safety as a fundamental and non-negotiable priority for national growth and development.
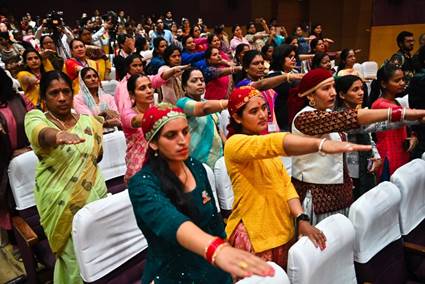
The launch event was attended by women leaders from Self Help Groups across the country, staff from service providers for redressal for survivors of violence against women and girls, such as One Stop Centres, and Aanganwadi workers, amongst others. To spread the awareness of the campaign to the remotest corners of the country, the launch was telecast live through the Webcast link and Ministry of Women and Child Development’s YouTube channel.
Globally, every year, from 25th November, which is observed as the International Day for the Elimination of Violence against Women, to 10th December, which is observed as the Human Rights Day, the 16 Days of Activism campaign is observed by civil society to raise awareness on ending gender-based violence.
YouTube Link -https://www.youtube.com/embed/xTcQfXFuRmo
The Ministry of Tourism undertakes various promotional activities in important and potential tourist generating markets with the objective of showcasing India’s tourism potential and promoting tourism to the country, including the state of Himachal Pradesh. Details of promotional activities are as follows:
i. Participation in international travel fairs and exhibitions such as World Travel Market (WTM) London, Feria Internacional de Turismo (FITUR) Madrid, International Travel & Hospitality Show (MITT) Moscow, Asia-Pacific Incentives and Meetings Event (AIME) Sydney, Internationale Tourismusbörse (ITB) Berlin, Arabian Travel Market (ATM) Dubai, International Meeting Exchange (IMEX) Frankfurt, International & French Travel Market (IFTM) Top Resa Paris, Japan Expo, Internationale Tourismusbörse Asia (ITB Asia), Singapore etc.
ii. The Chalo India initiative has been launched by the Ministry to encourage the huge Indian diaspora to become Incredible India ambassadors and encourage their five non-Indian friends to visit India, every year.
iii. A Chalo India portal has also been developed for registration of the Indian diaspora. Further gratis e visa to one lakh foreign tourists, visiting India under the referral program was announced.
iv. Ministry of Tourism has launched the Incredible India Content Hub on the revamped Incredible India digital portal (www.incredibleindia.gov.in) on 27th September, 2024. The Incredible India Content Hub is a comprehensive digital repository of high-quality images, films, brochures and newsletters which can be easily accessed by the industry stakeholders (travel media, tour operators, travel agents) across the globe required to amplify Incredible India in all their marketing and promotional efforts. The revamped Incredible India Digital Portal is a tourist-centric, one-stop digital solution designed to enhance the travel experience for visitors to India.
v. Inviting media personalities, tour operators and opinion makers to visit the country under the Hospitality Programme of the Ministry.
vi. The promotions are being carried out in association with the State Governments and the Overseas Indian Missions including the 20 identified Indian Missions.
Ministry of Tourism, Government of India is not the regulatory authority for deciding the rate structure charged by Tourism Stakeholders.

 PIB IFFI CAST AND CREW | Rajith/Supriya/Ashwani/Darshana | IFFI 55 – 114
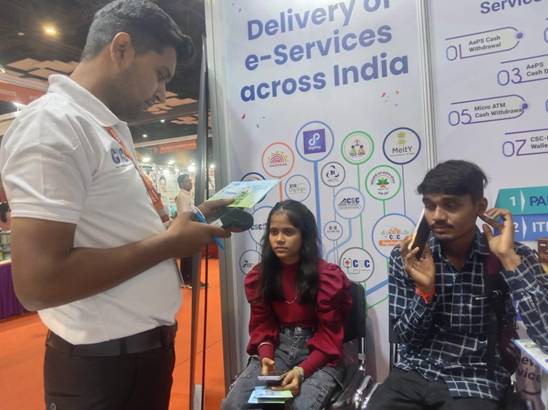


You must be logged in to post a comment.