Hospitals and medical facilities are saturated with information, and yet the patient leaves the appointment unbelievably confused. The chart contains too much technical jargon; the pamphlet resembles an ancient text; and the artwork never matches the explanation the physician offers in the examination room.
This explains why medical professionals are increasingly turning to AI generators like Dreamina to generate posters to illustrate medical information in a way that the patient can truly see and understand.
Medical information stays noticeable as posters
With AI-based design, even very detailed information like treatment procedures, medication timetables, and/or healing periods can be turned into nice, readable graphics. Rather than flooding them with words, you are providing them with something that only takes one quick look at, recall, and reference later. Dreamina simplifies the entire task of creating such graphics even for non-designers.
If patient education is visually appealing and easy to comprehend, patient trust will develop. And the result of patient trust is a willingness to comply, inquire, and self-manage.
Why medical visuals now mean so much
Patients are accustomed to being shown information in visual ways. They scroll, click, and zone in on things on a daily basis, so to step into an office where they are presented with a mass of words feels almost foreign to them. These posters blend icons, graphics, and simple design to meet the already existing needs of the patients.
Good visuals can also work as a means to combat anxiety. A poster that describes what happens during a procedure can calm nerves much better than a verbal explanation that goes on for a long time. Knowing what is going to happen can be less frightening than not knowing what’s going to happen.
Thus, many health care facilities have begun to move beyond general stock art to customized graphics made by artificial intelligence that serve their needs.
Benefit one: Clearer understanding in seconds
Good patient education poster communication occurs in a split second. Instead of reading three paragraphs about a disease, patients see it.
For example, one graphic might depict:
Where an organ is located
What part is affected
How the treatment works
In creating such a layout using Dreamina, you are, in fact, installing clarity within the layout. A person lacking health literacy can still go away with a newfound understanding of their condition from just this layout alone.
Benefit two: Content that matches real care
Stock photos tend to be too generic. They rarely correspond exactly to the procedure, device, or part of the body your patient has. Also, you can represent your practice in images that reflect your work on Dreamina.
This is where its AI image editor would prove to be very useful to you. Imagine you want a particular situation, and you can create an image of it, and then work on improving it until it suits your needs. This would ensure that there are no gaps between the language your doctors know and the pictures you hang on the wall.
Benefit three: Quicker updates regarding changing information
Medical standards evolve, treatment continues to advance, and clinics introduce new services. By the time posters are mass-produced, an upgraded version would be costly to produce.
“AI design reverses this process. When a protocol changes, you just have to alter the prompt and re-render the picture, and then you’re ready with a new poster to be distributed or printed,” he added. This ensures updated patient education without the need for frequent redesign.
Benefit four: Visually welcoming, not clinical
There is still a great deal of biomedical design that feels cold and frightening. Warm colors, pleasant characters, and clean design can make a big difference in how information is received.
Additionally, many of these come equipped with a design featuring a photo enhancer to brighten, sharpen, and soften the photo’s details, producing a warm, friendly poster rather than a cold one.
Benefit five: Easier sharing across spaces
The poster created by Dreamina does not necessarily have to be posted at one place only. The same image can be used on:
Waiting room screens
Clinic websites
Patient portals
Social media posts
This ensures consistency, making it easier to reinforce messages and bringing patient education as part of the total care experience rather than something dispensed at the reception desk.
Dreamina’s health lab: Main medical facts made friendlier with visuals
Dreamina helps to integrate all of the above by allowing health professionals to easily create graphics online. There’s no need to have a design team when you can create professional-looking posters in no time. All you need are instructions and a few minutes of creativity spent with Dreamina.
Step 1: Create the text message
Open Dreamina and log in, and go to the central creative area and concentrate on creating your patient education poster prompt. Consider writing about the subject matter and the design aesthetics.
A good example of what the prompt can be is: A straightforward patient education poster depicting the human heart and pointing out the blocked arteries and how the stent helps increase blood flow.
This kind of specificity enables Dreamina to generate an accurate and soothing visual presentation.
Step 2: Adjust parameters & generate
Select the model with good, precise, and clear illustrations, then set the aspect ratio based on where you intend to display the poster, whether it’s to be printed, displayed on a screen, or online. Select either 1k, which you can use for fast drafts, or 2k, which you can use for high-resolution printing. After everything is set, click on the icon of Dreamina to create your medical graphic.
Step 3: Customize and save
In Dreamina, you can use the inpaint tool to work on areas of the poster and make them clearer. Other features include expand, to give the design more space, remove, to get rid of elements that are unnecessary, and retouch, to give it a smooth look. Once you are satisfied with your poster and think it looks clear and professional, you can click on the Download icon to save and share with your patients.
Making patient education more human
When medical information is communicated visually, it turns from intimidating to empowering. Patients can point to a poster, ask questions about what they see, and remember the explanation later at home. It is that connection between image and understanding that will make AI-powered design so valuable in healthcare.
Dreamina empowers clinics and educators with a means to transform raw data into information that people can understand. It is not meant to replace medical expertise but rather supplement it by making one’s communication much clearer and even kinder.
Conclusion by feeling healthy with Dreamina
Turning medical data into patient-friendly posters isn’t just design; it’s care. When people understand their health, they make better choices and feel more confident about treatment options. In Dreamina, with just a few touches, you can create visuals that educate, reassure, and guide someone without needing a full creative team.
As healthcare continues to move toward clearer communication and patient-centered experiences, tools like Dreamina make bringing knowledge to life easier. You can help patients see their health in a whole new way with one thoughtful poster at a time.
Abdulrahman, M., Owusu, M. O., Anointed, D., Josiah, D. D., Mani, M., Muoghalu, F. E. F., & Peter, I. ode . ode . (2026). Prevalence and Determinants of Hepatitis B and C Infections among Adults in Rural Northern Nigeria: Evidence from Fufore Local Government Area Adamawa state. International Journal of Research, 13(1), 560–571. https://doi.org/10.26643/ijr/2026/27
Prevalence and Determinants of Hepatitis B and C Infections among Adults in Rural Northern Nigeria: Evidence from Fufore Local Government Area Adamawa state
Muhammad Abdulrahman1, Michael Oluyemi Owusu2, David Anointed1, Dennis Dibal Josiah3, Magaji Mani4, Fakunle Ebere Favour Muoghalu 5, Itua ode ode Peter 5
1 Faculty of Public Health Texila American University, Lot 2442, Plantation Providence, East Bank Demerara (EBD), Guyana, South America,
2Clinical Research Nurse, National Health Service (NHS), Queen Elizabeth Hospital, Mindelsohn way, Edgbaston Birmingham United Kingdom B15 2GW
3Principal Medical Officer Cottage Hospital Fufore
4Department of Nursing Science Specialist Hospital Yola, Adamawa State Nigeria.
5World Health Organization FCT Field Office, Plot 617/618 Diplomatic Drive, Central Area District, P.M.B. 2851, Garki, Abuja, Nigeria.
ABSTRACT
Background: Hepatitis B virus (HBV) and hepatitis C virus (HCV) infections remain major public health challenges in Nigeria, particularly in rural communities with limited access to prevention and screening services. This study determined the prevalence and determinants of HBV and HCV infections among adults in Fufore Local Government Area (LGA), Adamawa State, Nigeria.
Methods: A community-based cross-sectional study was conducted among 384 adults selected using a multistage sampling technique. Data were collected using an interviewer-administered structured questionnaire, and blood samples were tested for hepatitis B surface antigen (HBsAg) and hepatitis C antibody (anti-HCV) using rapid diagnostic test kits. Descriptive statistics were used to estimate prevalence. Chi-square tests assessed associations between independent variables and hepatitis infection. Multivariable logistic regression identified independent determinants of hepatitis infection, defined as positivity to either HBsAg or anti-HCV. Statistical significance was set at p < 0.05. Determinants were analyzed using a combined hepatitis infection outcome due to overlapping transmission risk factors.
Results: The mean age of participants was 34.8 ± 10.6 years. The prevalence of hepatitis B and hepatitis C infections was 17.2% and 11.7%, respectively, while 4.7% of participants had HBV–HCV co-infection. Overall, 33.6% of respondents tested positive for at least one hepatitis infection. Independent determinants of hepatitis infection included unprotected sexual intercourse (AOR = 2.41; 95% CI: 1.31–4.45), traditional unsafe invasive procedures (AOR = 2.13; 95% CI: 1.09–4.17), sharing of sharp objects (AOR = 2.56; 95% CI: 1.30–4.70), age 35–44 years (AOR = 1.89; 95% CI: 1.02–3.49), low educational level (AOR = 2.21; 95% CI: 1.08–4.53), and marital status (AOR = 1.73; 95% CI: 1.01–3.02).
Conclusion: The prevalence of hepatitis B and C infections among adults in Fufore LGA is high, indicating sustained transmission in this rural community. Behavioral and sociodemographic factors were significant determinants, underscoring the need for targeted screening, vaccination, and community-based risk-reduction interventions.
Keywords: Hepatitis B; Hepatitis C; prevalence; determinants; rural community; Nigeria.
INTRODUCTION
Background of the Study
Hepatitis B virus (HBV) and hepatitis C virus (HCV) infections remain major public health challenges globally, contributing substantially to liver-related morbidity and mortality. The World Health Organization (WHO) estimates that approximately 296 million people are living with chronic hepatitis B and 58 million with chronic hepatitis C worldwide, resulting in over 1.1 million deaths annually from complications such as cirrhosis and hepatocellular carcinoma (World Health Organization, 2023).
Sub-Saharan Africa bears a disproportionate share of the global hepatitis burden due to limited access to preventive services, suboptimal vaccination coverage, inadequate screening, and persistent high-risk behaviors (Olayinka et al., 2016). Nigeria is classified as a high-burden country for viral hepatitis, with a national hepatitis B prevalence estimated at approximately 8.1% and hepatitis C prevalence of about 2.2% in the general population (Tomas et al., 2021; Musa et al., 2022). However, evidence suggests that prevalence rates are often higher in rural and underserved communities, where healthcare access is limited and traditional practices involving non-sterile instruments remain common (Ndako et al., 2019).
Rural populations in northern Nigeria are particularly vulnerable to hepatitis transmission due to widespread engagement in unsafe traditional invasive procedures, sharing of sharp objects, and low awareness of transmission routes and preventive measures (Okonko et al., 2019). Anecdotal reports from local health facilities in Adamawa State indicate frequent detection of hepatitis B and C infections among adults seeking care, suggesting a potentially substantial but under-documented burden in rural communities.
Fufore Local Government Area (LGA) of Adamawa State is a predominantly rural setting characterized by farming and informal trading, with limited access to secondary and tertiary healthcare services. Despite the known risk profile of similar rural communities in northern Nigeria, there is a paucity of community-based epidemiological data on the prevalence and determinants of hepatitis B and C infections in Fufore LGA. Existing studies from Adamawa State and neighboring regions are largely facility-based or focused on specific subpopulations, limiting their generalizability to the wider adult population.
Addressing this gap is critical for informing targeted public health interventions, including hepatitis B vaccination scale-up, community-based screening, and culturally appropriate risk-reduction strategies. This study therefore assessed the prevalence and determinants of hepatitis B and C infections among adults in Fufore Local Government Area, Adamawa State, Nigeria.
Statement of the Problem
Despite global advancements in prevention and treatment, hepatitis B and C infections remain underdiagnosed, especially in rural communities in Nigeria (Musa et al., 2022). WHO identifies Nigeria as a high-burden country for HBV, with rural populations experiencing disproportionate risks due to widespread traditional invasive practices using non-sterile tools and inadequate access to healthcare services (WHO, 2023; Okwori et al., 2020).
In Fufore LGA, informal reports and field observations indicate potentially increasing prevalence of hepatitis infections among adults. High engagement in unsafe traditional invasive procedures, low awareness levels, and risky behaviors such as unprotected sex and unsafe sharing of sharp objects remain key contributors to transmission. However, there is limited local epidemiological data to guide evidence-based intervention strategies. This study therefore, determined the prevalence and determinants of hepatitis B and C infections among adults in Fufore LGA to facilitate informed public health actions for prevention and control.
Significance of the Study
This study will provide community-based evidence on the burden and determinants of hepatitis B and C infections in Fufore LGA. The findings are expected to inform public health strategies, support planning and implementation of targeted screening and vaccination programs, and guide community-based educational interventions to reduce transmission (WHO, 2023). Policymakers, healthcare providers, and stakeholders will benefit from the results in designing context-specific interventions.
Scope of the Study
The study focuses on adults aged 18 years and above residing in selected wards (Beti, Gurin, Ribadu, and Fufore) of Fufore LGA. It assesses the prevalence of hepatitis B and C infections and examines sociodemographic and behavioral determinants associated with their transmission.
Objectives of the Study
General Objective
To determine the prevalence and determinants of hepatitis B and C infections among adults in Fufore Local Government Area, Adamawa State, Nigeria.
Specific Objectives
To determine the prevalence of hepatitis B and hepatitis C infections among adults in Fufore Local Government Area.
To identify behavioral risk factors associated with hepatitis B and C infections among adults in Fufore Local Government Area.
To assess the association between selected sociodemographic characteristics and hepatitis B and C infections among adults in Fufore Local Government Area.
Research Questions
What is the prevalence of hepatitis B and hepatitis C infections among adults in Fufore Local Government Area?
Which behavioral risk factors are associated with hepatitis B and C infections among adults in Fufore Local Government Area?
What sociodemographic factors are associated with hepatitis B and C infections among adults in Fufore Local Government Area?
Research Hypotheses
Null Hypotheses (H₀)
H₀₁: There is no significant association between behavioral risk factors (unprotected sexual intercourse, sharing of sharp objects, and traditional unsafe invasive procedures) and hepatitis B and C infections among adults in Fufore Local Government Area.
H₀₂: There is no significant association between sociodemographic characteristics (age, sex, marital status, and educational level) and hepatitis B and C infections among adults in Fufore Local Government Area.
Alternative Hypotheses (H₁)
H₁₁: Behavioral risk factors (unprotected sexual intercourse, sharing of sharp objects, and traditional unsafe invasive procedures) are significantly associated with hepatitis B and C infections among adults in Fufore Local Government Area.
H₁₂: Sociodemographic characteristics (age, sex, marital status, and educational level) are significantly associated with hepatitis B and C infections among adults in Fufore Local Government Area.
Operational Definition of Terms
Burden: The prevalence of hepatitis B and C infections within the study population.
Determinants: Sociodemographic and behavioral factors contributing to hepatitis transmission.
Risk Factors: Actions or practices, such as unprotected sex, sharing sharp objects, or undergoing unsafe traditional invasive procedures, that increase the likelihood of acquiring infection.
MATERIALS & METHODS
Study design and setting
A community-based cross-sectional study was conducted in Fufore Local Government Area (LGA), Adamawa State, Nigeria. Four wards (Beti, Gurin, Fufore and Ribadu) were included. The area is predominantly rural; most residents are farmers, traders and artisans and access to secondary and tertiary health services is limited.
Study population
The study population comprised adults aged 18 years and above who had lived in the selected wards for at least six months at the time of data collection. Individuals who were critically ill or who declined to participate were excluded.
Sample size determination
The minimum sample size for prevalence studies was calculated using Cochran’s formula for proportions:
n =
Where Z = 1.96 (for 95% confidence), p = estimated prevalence, and d = desired precision (0.05).
Using the locally estimated prevalence for hepatitis B from preliminary field data (p = 0.172), the initial sample size was:
n = ≈ 218
Because a multistage cluster sampling approach was used, the sample size was adjusted for cluster design using a design effect (DEFF). A conservative design effect of 1.6was applied to account for intra-cluster correlation and the multistage procedure:
n1 = n × DEFF = 218 ×1.6 ≈349
To allow for non-response and incomplete data, a 10% contingency was added:
n = n1× (1+0.10) = 349 × 1.10 ≈384
Thus, the final sample size for the study was set at 384 participants.
Sampling procedure
A multistage sampling technique was implemented:
Ward selection (stage 1): Four wards (Beti, Gurin, Fufore and Ribadu) were purposively selected based on accessibility and local representation of the LGA.
Community selection (stage 2): Two communities were randomly selected from each of the four wards, yielding eight communities in total.
Household selection (stage 3): In each selected community, a household listing or estimate was used to calculate a systematic sampling interval. The target within-community sample was 48 participants per community (384 ÷ 8). A random start between 1 and k was chosen and every kth household was visited until 48 eligible participants were recruited.
Respondent selection (stage 4): In households with more than one eligible adult (≥18 years), one respondent was chosen by simple random selection (ballot method).
The final allocation was therefore 48 participants from each of the eight selected communities (48 × 8 = 384).
Data collection instruments and procedures
A structured interviewer-administered questionnaire was used to collect data on sociodemographic characteristics, knowledge and awareness of hepatitis, and exposure to potential risk factors (including unprotected sex, sharing of sharp instruments, and traditional invasive procedures). The questionnaire was developed in English, translated into the local languages (Hausa/Fulfulde) and back-translated to ensure accuracy.
Trained data collectors read the information sheet and consent script to prospective participants and obtained verbal informed consent prior to interview and testing. After the interview, each consenting participant underwent on-site rapid diagnostic testing for hepatitis B surface antigen (HBsAg) and hepatitis C antibody (anti-HCV) using WHO-recommended rapid test kits. Tests were performed by trained personnel following the manufacturers’ instructions and standard infection-prevention procedures (gloves, single-use lancets, safe disposal of sharps, surface disinfection). Rapid diagnostic test kits with manufacturer-reported sensitivity and specificity >99% were used.
Participants who tested positive on rapid test were counselled and provided with referral information for clinical follow-up and confirmatory testing at health facilities. All test results and responses to the questionnaire were recorded on coded study forms to protect confidentiality.
Rapid diagnostic testing results for HBsAg and anti-HCV were later recoded to generate a binary outcome variable (hepatitis infection: yes/no) for regression analysis.
Data management and analysis
Completed questionnaires and test result forms were checked daily for completeness and consistency. Data were entered into a statistical package (SPSS v26) and cleaned prior to analysis.
Descriptive analysis: Frequencies, proportions and means (± SD) were used to summarize sociodemographic variables and prevalence estimates. Prevalence of hepatitis B and hepatitis C were reported as proportions with 95% confidence intervals.
Bivariate analysis: Associations between categorical exposures (risk factors) and hepatitis serostatus were assessed using chi-square tests. Continuous variables were compared using t-tests.
Multivariable analysis: For regression analysis, hepatitis infection was defined as positivity to either hepatitis B surface antigen (HBsAg) or hepatitis C antibody (anti-HCV). Participants who tested positive for both HBsAg and anti-HCV were classified as having HBV–HCV co-infection and were included as positive cases in the combined hepatitis infection outcome. Variables with p < 0.20 in bivariate analyses were included in multivariable logistic regression models to identify independent determinants of hepatitis infection. Adjusted odds ratios (AOR) and 95% confidence intervals (CI) were reported. Statistical significance was set at p < 0.05.
Quality assurance
Data collectors underwent a two-day training covering the study objectives, questionnaire administration, informed consent procedures, rapid test performance, and infection prevention. A pilot test was carried out in a neighbouring community (not included in the main study) to refine the questionnaire and procedures. Supervisors performed daily checks on completed forms and observed testing procedures to ensure protocol adherence.
RESULT
Socio-demographic Characteristics of Respondents
A total of 384 adults participated in the study. The mean age was 34.8 ± 10.6 years (range: 18–65). Most respondents were aged 25–44 years (56.5%), female (54.4%), and married (61.2%). About48.7% had primary education, while 16.1% had no formal education.
Table 1: Socio-demographic Characteristics of Adult Respondents in Fufore Local Government Area, Adamawa State, Nigeria (n = 384)
Variable
Frequency (n)
Percentage (%)
Age (years)
18–24
77
20.1
25–34
110
28.6
35–44
107
27.9
≥45
90
23.4
Mean age ± SD
—
34.8 ± 10.6
Sex
Male
175
45.6
Female
209
54.4
Marital status
Single
78
20.3
Married
235
61.2
Divorced/Widowed
71
18.5
Education
No formal education
62
16.1
Primary
187
48.7
Secondary
89
23.2
Tertiary
46
12.0
Most respondents were within the active reproductive and economically productive age group (25–44 years), which aligns with previous studies reporting higher risk of viral hepatitis among adults due to increased exposure to behavioral risk factors (e.g., sexual activity and occupational hazards). A higher proportion of females may reflect improved healthcare-seeking behavior, similar to findings from hepatitis studies in Northern Nigeria. Lower educational attainment among nearly half of respondents may influence awareness and prevention practices relating to hepatitis. These sociodemographic patterns are consistent with findings from Gyamfi et al. (2020), who reported higher hepatitis vulnerability among adults aged 25–45 years, especially among married individuals and those with lower educational levels. Similarly, Musa et al. (2022) noted that lower education limits awareness of hepatitis prevention and contributes to increased infection risk.
Prevalence of Hepatitis B and C Infections
Of the 384 participants, 66 (17.2%) were positive for hepatitis B, 45 (11.7%) for hepatitis C, and 18 (4.7%)had co-infection.
Table 2: Prevalence of Hepatitis B, Hepatitis C, and HBV–HCV Co-infection among Adults in Fufore Local Government Area (n = 384)
Infection Status
Frequency (n)
Percentage (%)
Hepatitis B positive
66
17.2
Hepatitis C positive
45
11.7
Co-infection (HBV + HCV)
18
4.7
Negative
255
66.4
The observed HBV prevalence of 17.2% is higher than the national Nigerian average (~12%), suggesting a significant burden in this rural setting. The HCV prevalence (11.7%) is also elevated compared to sub-national reports (~7–9%), suggesting a high burden of infection in this rural community. The 4.7% co-infection rate highlights shared modes of transmission. Similar rural studies in Northeast Nigeria reported HBV prevalence between 14–18%, supporting these findings. The hepatitis B prevalence in this study (17.2%) aligns with findings by Agwale et al. (2018), who reported 16.8% among rural dwellers in Northern Nigeria. Similarly, the HCV prevalence (11.7%) is comparable to Musa et al. (2015), who found 10.5% in a related rural population. However, these figures are higher than the national estimate of HBV (8.1%) and HCV (2.2%) reported by Tomas et al. (2021), indicating a higher burden in underserved rural communities.
Distribution of Behavioral Risk Factors
Unprotected sex was the most common risk factor (59.6%), followed by unsafe traditional invasive procedures (56.5%) and sharp object sharing (50.5%).
Table 3: Distribution of Behavioral Risk Factors for Hepatitis Infection among Adults in Fufore Local Government Area (n = 384)
Risk Factor
Yes n (%)
No n (%)
Unprotected sexual intercourse
229 (59.6)
155 (40.4)
Traditional unsafe invasive procedures
217 (56.5)
167 (43.5)
Sharing sharp objects (blades/needles)
194 (50.5)
190 (49.5)
Previous blood transfusion
72 (18.8)
312 (81.2)
History of STIs
59 (15.4)
325 (84.6)
High engagement in unprotected sexual intercourse and unsafe invasive procedures contributes significantly to viral hepatitis transmission. Traditional practices involving scarification and tribal markings remain prevalent in rural communities, corroborating findings from Northern Nigeria. Sharp object sharing is common due to low access to sterile instruments. These findings are comparable to those of Okonko et al. (2019), who identified unprotected sex and sharing of sharp objects as the primary transmission routes in rural Nigerian populations. Orji et al. (2013) also emphasized the role of cultural invasive practices such as scarification in driving hepatitis transmission among communities with limited access to modern healthcare.
Association between Selected Factors and Hepatitis Infection
Bivariate analysis using the chi-square test showed statistically significant associations between hepatitis infection and marital status (χ² = 6.15, p = 0.046), unprotected sexual intercourse (χ² = 6.80, p = 0.009), exposure to traditional unsafe invasive procedures (χ² = 5.12, p = 0.024), and sharing of sharp objects (χ² = 7.05, p = 0.008). Sociodemographic variables with incomplete cross-tabulated data were not included in the chi-square analysis but were assessed in the multivariable logistic regression model.
Table 4: Bivariate Association between Selected Behavioral Factors and Hepatitis Infection among Adults in Fufore Local Government Area (n = 384)
Variable
Hepatitis Positive n (%)
Hepatitis Negative n (%)
χ²
p-value
Marital status
6.15
0.046
Married
48 (20.4)
187 (79.6)
Others (single/divorced/widowed)
18 (12.9)
131 (87.1)
Unprotected sexual intercourse
6.80
0.009
Yes
46 (20.1)
183 (79.9)
No
20 (12.9)
135 (87.1)
Traditional unsafe invasive procedures
5.12
0.024
Yes
41 (18.9)
176 (81.1)
No
25 (15.0)
142 (85.0)
Sharing sharp objects
7.05
0.008
Yes
39 (20.1)
155 (79.9)
No
27 (14.2)
163 (85.8)
Footnote: Hepatitis infection was defined as positivity to either hepatitis B surface antigen (HBsAg) or hepatitis C antibody (anti-HCV). Percentages are row percentages. Chi-square test was used to assess associations. Statistical significance was set at p < 0.05.
Multivariable Logistic Regression Analysis of Determinants of Hepatitis Infection
Because the study aimed to identify shared community-level determinants, HBV and HCV outcomes were combined into a single ‘hepatitis infection’ variable for regression analysiscdo
Table 5: Multivariable Logistic Regression Analysis of Determinants of Hepatitis Infection among Adults in Fufore Local Government Area, Adamawa State, Nigeria (n = 384)
Determinant
AOR
95% CI
p-value
Interpretation
Unprotected sex
2.41
1.31–4.45
0.005
Significant
Traditional unsafe procedures
2.13
1.09–4.17
0.028
Significant
Sharing sharp objects
2.56
1.30–4.70
0.006
Significant
Age (35–44 years)
1.89
1.02–3.49
0.041
Significant
Low education (none/primary)
2.21
1.08–4.53
0.030
Significant
Marital status (married)
1.73
1.01–3.02
0.048
Significant
Sex
1.12
0.67–1.87
0.542
Non-significant
Footnote: Hepatitis infection was defined as positivity to either hepatitis B surface antigen (HBsAg) or hepatitis C antibody (anti-HCV). Participants who tested positive for both HBsAg and anti-HCV were classified as having HBV–HCV co-infection and were included as positive cases in the regression model. AOR = Adjusted Odds Ratio; CI= Confidence Interval.
Behavioral factors (unprotected sex, sharp instrument sharing, and unsafe traditional procedures) were independently associated with a two – to three-fold higher odds of hepatitis infection. Sociodemographic determinants such as middle-age, low education, and marriage also showed independent associations. These findings mirror similar studies across Sub-Saharan Africa that emphasize both cultural and behavioral drivers of transmission. These determinants are in line with observations by Ndako et al. (2019), who identified unsafe traditional procedures and low education as independent predictors of hepatitis infection. The increased risk among married adults supports findings from Abdou et al. (2020), which linked marital sexual exposure to higher viral hepatopathy rates due to low condom usage.
DISCUSSION
This study examined the prevalence and determinants of hepatitis B and C infections among adults in Fufore Local Government Area, Adamawa State, Nigeria. The findings demonstrate a substantial burden of hepatitis infection in this rural population, reinforcing concerns that viral hepatitis remains an under-recognized public health problem in underserved communities with limited access to preventive and screening services.
Bivariate Associations
Bivariate analysis using the chi-square test revealed significant associations between hepatitis infection and selected behavioral factors, including marital status, unprotected sexual intercourse, exposure to traditional unsafe invasive procedures, and sharing of sharp objects. These associations highlight the importance of behavioral and cultural practices in shaping hepatitis transmission dynamics in rural settings. Similar findings have been reported in previous Nigerian and sub-Saharan African studies, where unsafe sexual practices and informal invasive procedures contribute significantly to hepatitis transmission.
The observed association with marital status may reflect differences in sexual behavior patterns and cumulative exposure risks; however, this finding should be interpreted cautiously, as marital status may serve as a proxy for other unmeasured behavioral or social factors. Overall, the bivariate findings suggest sustained community transmission driven largely by preventable behavioral exposures.
Multivariable Analysis
Multivariable logistic regression identified independent predictors of hepatitis infection after adjusting for potential confounders. The persistence of behavioral risk factors as significant predictors in the adjusted model underscores their central role in ongoing hepatitis transmission within the study population. Unlike bivariate analysis, the regression model allowed for simultaneous assessment of sociodemographic and behavioral variables, providing a more robust understanding of factors independently associated with hepatitis infection.
Sociodemographic variables, including age and education level, were assessed in the regression model despite not being included in the chi-square analysis due to incomplete cross-tabulated data. Their inclusion in the multivariable analysis strengthens the validity of the findings by accounting for confounding influences that may not be evident in unadjusted comparisons.
Hepatitis B Virus (HBV)
The burden of hepatitis B infection observed in this study has important public health implications, particularly given the availability of an effective vaccine. The findings suggest gaps in hepatitis B vaccination coverage among adults in rural communities, where routine screening and catch-up vaccination programs are often limited. Continued exposure to unsafe sexual practices and invasive cultural procedures further increases the risk of HBV transmission. Strengthening hepatitis B vaccination strategies, including adult catch-up vaccination and improved access to screening services, is critical to reducing HBV-related morbidity in rural populations.
Hepatitis C Virus (HCV)
Hepatitis C infection, which lacks a preventive vaccine, was also prevalent among study participants and was closely linked to blood-borne risk behaviors such as sharing sharp objects and exposure to unsafe traditional procedures. These findings are consistent with the known transmission pathways of HCV and emphasize the need for enhanced screening and early detection strategies. Integrating routine HCV screening into primary healthcare services, particularly in rural and high-risk communities, is essential for timely diagnosis and linkage to care.
Public Health Implications
Overall, the findings suggest sustained community transmission of viral hepatitis in Fufore LGA, driven largely by modifiable behavioral and cultural practices. Targeted community-based health education, regulation of traditional invasive practices, expansion of hepatitis B vaccination coverage, and improved access to hepatitis C screening are critical interventions for reducing the burden of viral hepatitis in rural Nigerian communities.
CONCLUSION
This study demonstrates a high burden of hepatitis B and C infections among adults in rural Fufore Local Government Area, with infection strongly associated with behavioral and cultural risk practices. The findings highlight persistent gaps in hepatitis prevention services, particularly hepatitis B vaccination coverage and access to hepatitis C screening. Addressing unsafe traditional practices, strengthening behavioral risk reduction interventions, and scaling up hepatitis prevention and screening programs are urgently needed to reduce the burden of viral hepatitis in rural Nigeria.
Authors’ Contributions
Muhammad Abdulrahman conceived and designed the study, analyzed the data, and drafted the manuscript. Michael Oluyemi Owusu contributed to study design and critically reviewed the manuscript. David Anointed and Dennis Dibal Josiah supported data collection and field supervision. Magaji Mani provided technical public health input. Muoghalu Ebere Favour and Itua Ode Ode Peter contributed to data interpretation and manuscript revision. All authors reviewed and approved the final manuscript and accept responsibility for its content.
Conflict of Interest:The authors declare that they have no competing interests.
Source of Funding: None
REFERENCES
Abdou, R., Hassane, M., Moussa, A., & Oumarou, H. (2020). Sexual behaviour, marital status and risk of viral hepatitis infection among adults in Sub-Saharan Africa. African Journal of Reproductive Health, 24(3), 102–111.
Agwale, S. M., Tanimoto, L., Womack, C., & Watanabe, K. (2018). Prevalence of hepatitis B virus infection among rural populations in Northern Nigeria. Journal of Viral Hepatitis, 25(7), 785–792.
Gyamfi, C., Agyeman, A. A., & Frempong, M. T. (2020). Sociodemographic determinants of viral hepatitis infection among adults in rural West Africa. BMC Public Health, 20(1), 1458–1466.
Musa, B. M., Bussell, S., Borodo, M. M., Samaila, A. A., & Femi, O. L. (2015). Prevalence of hepatitis C virus infection in Nigeria, 2000–2013: A systematic review and meta-analysis. Nigerian Journal of Clinical Practice, 18(2), 163–172.
Musa, B. M., Zubair, S. A., Samaila, A. A., & Borodo, M. M. (2022). Epidemiology of viral hepatitis in Nigeria: Burden, transmission dynamics and public health implications. Annals of African Medicine, 21(1), 1–9.
Ndako, J. A., Onwuliri, E. A., & Agabi, Y. A. (2019). Risk factors associated with hepatitis B and C infections in rural Nigerian communities. Journal of Community Health, 44(4), 785–793.
Okonko, I. O., Okerentugba, P. O., & Akinpelu, A. O. (2019). Transmission dynamics of hepatitis B and C viruses in rural Nigerian settings. African Health Sciences, 19(1), 1839–1848.
Okwori, A. E. J., Sadiq, M. N., & Ngwai, Y. B. (2020). Traditional practices and the risk of blood-borne viral infections in rural Nigeria. Nigerian Medical Journal, 61(2), 67–74.
Olayinka, A. T., Oyemakinde, A., Balogun, M. S., Ajudua, A., Nguku, P., Aderinola, M., & Nasidi, A. (2016). Seroprevalence of hepatitis B infection in Nigeria: A national survey. The American Journal of Tropical Medicine and Hygiene, 95(4), 902–907.
Orji, M. O., Mba, N. C., & Ogbu, O. (2013). Cultural practices and risk of viral hepatitis transmission in rural African populations. Journal of Infection in Developing Countries, 7(6), 455–461.
Tomas, J., Adekanle, O., & Adebayo, S. (2021). National prevalence of hepatitis B and C infections in Nigeria: A systematic review. Pan African Medical Journal, 38, 132–141.
World Health Organization. (2023). Global hepatitis report 2023. World Health Organization.
The surge in international interest toward the Ukrainian market has created a unique linguistic challenge. As global organizations, NGOs, and tech giants scale their presence in the region, the reliance on generic machine translation or non-specialized linguists has proven to be a costly gamble. Today, the role of translators for Ukraine has evolved from simple text conversion to a sophisticated form of cultural and technical consultancy.
Navigating the Nuances of a Living Language
Ukrainian is currently undergoing a period of rapid linguistic evolution. New terminology is emerging in the fields of defense, digital governance, and law, while older, borrowed structures are being replaced by authentic local forms.
Why Contextual Expertise Matters
Standard translation often misses the mark because it ignores the specific professional environment of the target audience. Dedicated translators for Ukraine provide:
Sector-Specific Accuracy: Whether it is the ISO-compliant language of heavy industry or the dynamic “slang” of the IT sector.
Dialectal Sensitivity: Understanding the differences between formal Western-style business Ukrainian and the more colloquial variations used in central regions.
Tone of Voice Management: Adapting global brand identities to sound authoritative yet approachable to a local consumer.
The Technological Edge: Human-Centric Innovation
Modern translation is no longer a manual, pen-and-paper process. At Technolex, our linguists leverage advanced infrastructure to maintain quality at scale.
By utilizing Computer-Assisted Translation (CAT) tools, our experts can maintain massive terminology databases. This ensures that a specialized term used in a contract remains identical in a product manual, regardless of how much time has passed between projects. This consistency is what separates a world-class brand from a temporary market player.
Protecting Integrity Through Multi-Stage Review
The greatest risk in localization is the “silent error”—a mistranslation that is grammatically correct but factually wrong. To prevent this, professional translators for Ukraine operate within a strict “TEP” workflow:
Translation: Drafted by a subject matter expert.
Editing: A second linguist checks for technical accuracy and flow.
Proofreading: A final polish to ensure zero formatting or spelling issues.
This rigorous structure is the only way to guarantee that your documentation meets the high standards of the Ukrainian regulatory environment. In a country that values precision and resilience, your choice of language partner is the strongest signal of your respect for the local market.
Design is no longer left for designers alone. Today, founders, marketers, and creators with zero formal training produce visuals that look polished and professional-and all too often, it starts with a transparent background maker.
Thanks to tools like Pippit, non-creators can instantly remove clutter, isolate the key subject, and create clean graphics for social posts, presentations, or brand assets. Instead of wrestling with complicated software, they focus on storytelling and layout, turning simple ideas into visuals that feel intentional, consistent, and ready to impress.
It’s not about knowing software. It’s about removing friction, starting with the background.
The confidence gap that non-designers don’t talk about
Those people who say, “I am not creative,” are not struggling to find ideas. They are struggling to feel confident with the execution. They understand what it is that they want to communicate, but they don’t know how to communicate it in a way that makes it seem like it was a deliberate act.
This ambivalence results in:
Overcrowded visuals
Using too many fonts and/or colors
Intuitive Design
Design that appears to be accidental, not planned
Taking out the background may be the first point in the process where non-designers feel control instead of confusion.
Why transparent visuals feel instantly professional
Clean cut-out changes perception. Where the background disappears, the subject gains clarity, focus, and flexibility. Even simple layouts start to feel designed.
Non-creators catch this shift out of the corner of their eye. The same image that felt amateur suddenly feels ready for:
A website hero
Social post
A slide
A promo graphic
That transformation gains momentum.
How beginners accidentally discover good design principles
Surprisingly, clear graphics teach the basics of design without design training. By elaborating on cutouts, nonspecialists naturally acquire a feel for:
Visual hierarchy, because the subject stands out.
Negative space, because there’s room to breathe.
Balance, because placement matters more than decoration.
They’re not learning theory; they’re learning by doing it.
The quiet power of not starting from scratch
One of the biggest design mistakes that beginners have is starting on a blank canvas. Transparent assets eliminate that fear.
When you’re starting with a clean subject, decisions feel lighter. You’re placing, not inventing. You’re adjusting rather than guessing.
That shift makes design feel approachable instead of intimidating.
Where transparency is situated within work processes
Non-creators don’t design for enjoyment—they design out of necessity. The insertion of transparent backgrounds has a natural place within real-world design projects.
The founders apply them to make pitch visuals.
They are used for social purposes and ads by marketers.
They are utilized for brand identity development.
Because assets are repeatable, the process multiplies as opposed to recycling every time.
When simplicity triumphs over decoration
Non-designers have had a major wake-up call learning that sometimes—and in graphic design it is often true—less is indeed more.
Clean visuals do not require much processing or text, and many teams opt to simplify visuals once they are reused or remove text from video clips so that the visual is versatile regardless of the context in which they will be used.
Instead, clarity is what is sought after.
What non-creators love most about transparent assets
“Transparent” visuals eliminate the element of guesswork. It’s easier, in effect, to produce what feels right without being able to say why.
Non-designers usually point to:
Faster turnaround time
Fewer Revision Cycles
More flexibility and ease of modification
Less Increasing confidence sharing pictures publicly
It is an attitude that can be contagious—it spurs experimentation.
How transparent backgrounds create a design gatekeeping silence
When non-creators can single out an object within seconds, they stop regarding design as an area of specialization but as communication itself. This kind of attitude is highly effective.
A transparent background creator does not offer training on typography and color concepts. The largest visual obstacle removed by it, however, is clutter.
Why “looking professional” isn’t about perfection
Professional visualizations aren’t foolproof–they are consistent, understandable, and deliberate. Opacity allows non-designers to accomplish the bare minimum without stress.
When visuals seem intentional, a change occurs in audience reactions. Trust is built. Engagement is enhanced. Credibility is established.
Without a degree in design.
Pippit makes visual confidence accessible
Pippit isn’t about making everyone a designer. It is about enabling individuals to communicate visual ideas with ease and confidence, rather than feeling limited or doubting any decision made.
Thanks to Pippit and the use of storyboarding tools like its AI storyboard generator, non-creators are starting to think in visual terms without having to learn design principles.
Pippit simplifies background removals and asset creation, allowing non-creators to easily express their story without being burdened by tooling.
It is this freedom that ensures all the outcomes appear professional.
Design without designers is the new normal
With the reduction in creative hurdles presented by AI tools, the distinction between the “designer” and the “non-designer” is increasingly blurred. What is now imperative is the clarity of the message rather than the skills involved.
One of the simplest methods of blurring that line, and one that, when crossed, proves impossible to turn back, is having transparent backgrounds.
Ready to create beautiful graphics without needing a professional designer? Check out Pippit and get designing with confidence – even if creativity has never been something that has been a part of your skill set!
Office wall art should look orderly and stay secure. This guide covers safe mounting heights, clean spacing, and hardware choices for an office canvas print setup that works in busy workspaces.
Plan the Layout First
Measure the wall and nearby furniture
Measure the wall, then note what sits under it: desks, credenzas, benches, or a reception counter. Check door swings and walk paths so artwork corners are not in the way.
Before you plan the final placement, identify the wall surface (drywall, brick, concrete, or glass partition) and confirm what your building allows. Many offices also have hidden cable runs and sensors. A quick scan with a stud finder and a look at building drawings can prevent drilling into something you should not touch.
Choose the right size for the wall
One larger piece often reads cleanly in a focused work zone. Longer walls can handle a set of two or three pieces when the gaps are consistent. A helpful sizing check is to keep the full artwork width around two-thirds to three-quarters of the furniture width below it.
For meeting rooms, hallways, and workstations, explore Office Canvas Prints and pick a size that matches the wall width and viewing distance. If people mainly view the wall while seated, keep the center slightly lower than a standing-height corridor.
Mock up before you drill
Tape paper templates to the wall and step back to where people will view the art. Adjust until the placement feels centered and straight next to furniture and lighting. For sets, label templates so you do not mix up the order when you start drilling.
Standard Mounting Heights That Work in Offices
Use the eye-level center rule
A solid starting point is to place the center of the artwork around 57–60 inches (145–152 cm) from the floor. Keep a similar center line across a room so walls feel organized.
Hang art above desks and credenzas
When artwork sits above furniture, keep the bottom edge about 6–10 inches (15–25 cm) above the top surface. If the furniture is tall, start closer to 6 inches so the art does not drift too high.
Reception areas and corridors
In reception areas, use the same center-height approach rather than pushing art upward for tall ceilings. In hallways, leave enough side clearance so bags and shoulders do not brush the edges.
Spacing Rules for Single Pieces and Groupings
Single piece spacing
Give a single office art print room from trim, corners, and shelving. If the wall has switches or thermostats, keep the art far enough away that the wall does not feel crowded.
Two- and three-piece sets
Keep gaps consistent. A 2–4 inch (5–10 cm) gap between canvases works well on office walls. Measure edge to edge and check the gap in more than one spot before tightening hardware.
To center a set, calculate the full width of the group (all pieces plus the gaps), then mark the midpoint on the wall. Work outward from that center mark. If you have a laser level, use it to keep the top edges aligned across the full group.
Gallery-style layouts
Pick one alignment system—top edges, bottom edges, or a shared center line—and follow it across the whole group. If you are mixing sizes, build from the center outward so the group stays centered.
Hardware Choices for Safe Installation
Studs, anchors, and weight limits
Use studs when you can, especially for heavier pieces. If studs are not available where you need them, choose heavy-duty anchors made for your wall type and follow the rated limits on the packaging. When in doubt, select hardware rated well above the artwork weight to allow a safety buffer.
Hanging methods that reduce shifting
Two-point hanging helps keep frames from tilting. For larger pieces, French cleats can hold the art flatter to the wall and reduce movement in busy areas. Small bumpers on the lower corners can also help keep frames steady.
Alternatives for offices that change layouts often
If your office refreshes walls regularly, a rail-and-cable system can reduce wall damage because you adjust hooks rather than drill new holes. This approach is common in hallways and reception zones where artwork is updated seasonally or for events.
Match art to client-facing spaces
For conference rooms and reception walls, themes like leadership, teamwork, and growth fit many workplaces. If you want pieces built around these ideas, browse Business Concept Canvas Prints and choose sizes that suit your room scale.
Lighting and Glare Checks
Check the wall with lights on and at different times of day. Windows and strong overhead fixtures can create glare. If needed, shift the art a little or adjust nearby lighting angles.
Tools and Materials You’ll Want Ready
Tape measure, pencil, and painter’s tape
Level (or a leveling app)
Stud finder
Drill/driver, screws, and wall anchors
Step stool or ladder approved for your workplace
Step-by-Step Office Art Installation Workflow
Mark the center height. Lightly mark where the artwork center should sit.
Measure the hanging offset. Measure from the top of the frame to the hook point on the back.
Set hardware. Use studs when possible; otherwise install anchors rated for the weight.
Hang and level. Hang the piece, level it, then tighten hardware and recheck.
Verify clearance. Open nearby doors, roll a chair back, and confirm nothing catches the frame.
For grouped pieces, hang the center piece first (or the center line for a grid), then work outward. Step back to the normal viewing distance and confirm the gaps read evenly from that angle.
Quick Rules for Clean Placement
Keep the artwork center near 57–60 inches (145–152 cm) from the floor.
Above furniture, keep the bottom edge about 6–10 inches (15–25 cm) above the surface.
For sets, keep gaps consistent—2–4 inches (5–10 cm) is a practical range.
Use two hanging points for better stability in busy areas.
Where Office Wall Art Fits Best
Plan placement by zone. Reception areas often suit one larger piece behind the desk. Work zones can use office wall art near collaboration tables, for Office Walls in shared corridors, or for Home Office corners where the art becomes a clean backdrop for video calls. Hallways and entryways work best when you keep walking space clear, while lounge seating areas can handle wider pieces above the backrest as long as the bottom edge stays safely above head level.
Common Mistakes to Avoid
Hanging too high: Use the center-height rule, not the ceiling height.
Uneven gaps: Measure every gap and keep tape guides up until the last screw is set.
Under-rated hardware: Match anchors and screws to the wall type and the weight.
FAQs: Mounting Heights, Spacing, and Safety
1) What height should office wall art be hung?
Start with a center height of 57–60 inches (145–152 cm).
2) How high should I hang art above a desk or credenza?
Keep the bottom edge about 6–10 inches (15–25 cm) above the surface.
3) How much space should be between two canvases?
A 2–4 inch (5–10 cm) gap works well in most offices.
4) How do I space a three-piece set?
Use the same gap between each piece and center the full group on the wall.
5) Should I align by the top edge or the center line?
Pick one system and stick with it; a shared center line is often easiest for mixed sizes.
6) What is the safest way to hang a heavier frame on drywall?
Use studs when possible; otherwise use anchors rated for the weight and wall type.
7) Is wire hanging safe for offices?
It can be, but two-point hanging often stays steadier in busy areas.
8) What is a French cleat?
A two-part mount that holds artwork flat and secure, useful for larger pieces.
9) How do I keep frames from tilting?
Use two hooks when the frame allows it, and add bumpers on the lower corners.
10) How close can art be to a doorway?
Leave clearance for the door swing and foot traffic so edges are not bumped.
11) What if the wall is brick or concrete?
Use a masonry bit and anchors made for that surface, and confirm building rules first.
12) How do I avoid glare on office art?
Check reflections during the day and under office lighting, then adjust placement or light angles.
13) Should art be centered on the wall or on the furniture?
Above furniture, center to the furniture width; on a blank wall, center to the main sightline.
14) How do I hang art in a hallway?
Keep the center height consistent and leave enough side clearance for people to pass.
15) What is a fast way to plan a gallery wall?
Use paper templates, tape them up, and mark the hardware points through the paper.
Final Check
After installation, do a gentle tug test and recheck level. Consistent heights, even gaps, and the right hardware help office prints look neat and stay secure.
Mashrafi, M. (2026). Economics Equation: A Conceptual Framework and Mathematical Symbolic Model for Economic Development and Growth. Journal for Studies in Management and Planning, 12(1), 65–74. https://doi.org/10.26643/jsmap/2026/3
Mokhdum Mashrafi (Mehadi Laja) Research Associate, Track2Training, India Researcher from Bangladesh Email: mehadilaja311@gmail.com
Abstract
This paper proposes a conceptual economic framework, titled Economics Equation–3, to explain how economies transition from low or medium development levels to stronger and sustainable growth trajectories. Drawing from economic systems theory, conceptual modeling, and symbolic mathematical reasoning, the model identifies and integrates key positive growth factors, market flow dynamics, and negative constraints into a unified symbolic structure. The framework considers the interaction between product characteristics, manpower, market accessibility, policy intervention, and temporal–spatial variation. The study aligns with existing literature emphasizing the role of conceptual frameworks in modern economics, mathematical modeling for growth, and evolutionary economic theory (Fusfeld, 1980; Debreu, 1984; Dopfer, 2005; Vasconcelos, 2013; Czerwinski, 2024). The resulting conceptual model is intended to support future empirical studies, economic policy analysis, business strategy formulation, and long-term development planning. The work remains theoretical and hypothesis-driven, highlighting the need for empirical validation in diverse economic contexts.
1. Introduction
Economic development has long been understood as a multidimensional and evolutionary process that extends beyond the influence of any single variable. Rather than emerging from isolated improvements in production, technology, or policy, development reflects a coordinated transformation involving structural, institutional, and market-based forces that interact across time and space. Classical economic thought emphasized capital accumulation, labor productivity, and technological progress as core growth determinants, while contemporary approaches increasingly highlight institutional quality, market integration, innovation dynamics, spatial inequalities, and global interdependencies as critical drivers of development outcomes. This conceptual transition from linear to systemic interpretations of economic change underscores the need for analytical models capable of capturing the complexity and interdependence inherent in real-world economic systems.
The role of theoretical and mathematical modeling in understanding growth phenomena has been well recognized in economic literature. Debreu (1984) famously argued that mathematics provides a language for economics that enables precise reasoning, formal abstraction, and analytical clarity. Through mathematical modeling, economists can represent structural relationships and investigate counterfactual scenarios in ways that narrative reasoning alone cannot achieve. In a similar vein, Petrakis (2020) emphasizes that economic growth and development theories benefit from interdisciplinary modeling approaches that combine economics with quantitative, geographical, behavioral, and institutional perspectives. These approaches demonstrate that conceptual and mathematical frameworks do not replace empirical economics but rather enhance its interpretive and predictive capabilities.
In parallel with formal mathematical modeling, conceptual frameworks have played an essential role in structuring economic inquiry. Conceptual frameworks help researchers identify relevant variables, establish theoretical boundaries, and define causal or systemic linkages. For example, Ghadim and Pannell (1999) used conceptual modeling to examine innovation adoption in agricultural contexts, illustrating how behavior, information, and perceived risk shape technology diffusion. Similarly, Ramkissoon (2015) applied a conceptual framework to understand cultural tourism development in African island economies, demonstrating that place-based authenticity, satisfaction, and attachment interact with economic outcomes. At the macroeconomic level, Fusfeld (1980) outlined the conceptual foundations of modern economics to explain how market structure, institutional change, and policy influence national and global economic systems. Together, these examples show that conceptual frameworks serve as bridges between theoretical abstraction and empirical analysis, fostering analytical clarity in complex problem spaces.
Mathematical modeling complements conceptual frameworks by introducing symbolic and computational precision. Vasconcelos (2013) demonstrated how symbolic and numerical models can be used to explore economic growth trajectories, revealing nonlinear patterns and dynamic behavior that traditional verbal models struggle to represent. Debreu (1989) further emphasized that mathematical expression enhances economic content by imposing logical structure, enabling comparison across models, and allowing results to be replicated or extended. The convergence of conceptual and mathematical modeling traditions therefore reflects an ongoing evolution in economics: from discipline-specific reasoning to systemic and interdisciplinary analysis.
It is within this intellectual environment that the present study introduces Economics Equation–3, a symbolic and conceptual model designed to address a central research question: “What policies, structural factors, and economic forces are necessary to transform an economy from low or medium levels to a strong and sustainable state?” While conventional growth theories isolate individual variables—such as capital, labor, or technology—the proposed framework focuses on dynamic interactions between growth-supporting conditions, market flow dynamics, and limiting constraints. This perspective is especially relevant because real economies rarely follow smooth linear trajectories; instead, they evolve through feedback loops, structural bottlenecks, policy shocks, and adaptive changes.
By identifying underlying economic drivers and constraints, the framework highlights how productive capacity, market accessibility, temporal variability, and policy design interact to shape development pathways. For example, workforce motivation, product purity, and domestic sales strength may contribute positively to economic performance, while logistical inefficiencies, demand volatility, and external shocks may offset these gains. The resulting economic outcome depends not merely on improving positive factors but on managing the interaction between enabling and limiting forces. This systems-oriented reasoning aligns with evolutionary and complexity-based economic perspectives that conceptualize economies as adaptive systems rather than mechanical machines (Dopfer, 2005). In evolutionary frameworks, development emerges through processes of variation, selection, and diffusion across firms, industries, and regions—implying that structural change, institutional adaptation, and feedback loops are central to sustainable growth.
Moreover, as economies globalize, market flows are increasingly shaped by spatial and temporal conditions. Consumer behavior varies across demographic segments; place influences logistics, market access, and resource distribution; and time captures seasonal, cyclical, and long-term shifts in demand and policy. Integrating these dimensions into conceptual modeling enables more realistic representations of economic transformation. The Economics Equation–3 framework incorporates these dynamics through its treatment of customers, place, and time as critical modifiers of market flow.
In summary, the Economics Equation–3 framework builds upon longstanding traditions in conceptual economics, mathematical modeling, and evolutionary development theory. It offers a structured approach for analyzing how economies transition from lower developmental stages toward stronger, more resilient states. While the model presented is conceptual and symbolic rather than empirical or predictive, it provides a foundation for future research, simulation, policy evaluation, and strategic planning. Rather than seeking to replace classical growth theories, the framework aims to complement them by emphasizing systemic interactions, constraint management, and adaptive economic dynamics.
2. Methods and Modeling Framework
Figure 1 illustrates the methodological framework employed in this study, outlining the sequential process of factor identification, system flow conceptualization, and symbolic performance modeling. The figure shows how positive growth drivers (A), market flow dynamics (F), and negative constraints (C) interact to influence economic outcomes.
Figure 1: Methodological Framework
2.1 Conceptual Factor Identification
The first methodological stage involved identifying key positive and negative economic factors influencing productivity, market flow, and performance. Drawing from conceptual economic literature and practical development considerations, the following factors were determined to be fundamental:
product quality and availability, convertible cost, utilization efficiency, demand, manpower and motivation, product purity, domestic and foreign sales ratings, transportation cost, seasonal popularity, temporal and spatial demand shifts, policy support, and contextual externalities.
These reflect broader economic categories such as production capacity, market access, and institutional capability—recognized in both classical and contemporary development theory (Weaver, 1993; Petrakis, 2020).
2.2 System Flow Conceptualization
The economic system is modeled as an interaction among:
A (+): positive growth factors,
Flow: market dynamics influenced by customer, place, and time,
C (−): negative constraints and risks.
This approach aligns with systemic frameworks in evolutionary economics and structural development theory (Dopfer, 2005). Symbolic operators (+, −, ×, %, #, !, /, &) were assigned meaning to represent growth amplification, constraints, multipliers, efficiencies, bottlenecks, shocks, allocations, and interdependencies.
2.3 Mathematical Symbolic Modeling
The economic performance of an entity (firm, sector, or nation) is expressed as:
where = time, = place/geography, = customer characteristics. Positive factors and negative factors are defined as vectors, and flow represents market access modified by time, space, and demand.
This symbolic modeling approach reflects the broader movement of “mathematics serving economics” (Czerwinski, 2024) and Debreu’s mathematical mode of representing economic content (Debreu, 1984).
3. Results
Application of the proposed conceptual structure—Economics Equation–3—provides several meaningful results concerning the nature of economic development, the determinants of economic performance, and the strategic implications for policy and market actors. Although the framework remains theoretical, its symbolic and structural features yield clear insights into how economic growth unfolds within a dynamic environment influenced by productive forces, market flow, and negative constraints.
First, the model reveals that economic growth emerges from interaction rather than isolation. Traditional growth models often emphasize individual factors such as capital accumulation, labor force expansion, or technological advancement. However, the symbolic relationship expressed as demonstrates that a single improved variable—such as product quality, workforce motivation, or manufacturing efficiency—is insufficient to produce sustained gains unless accompanied by favorable conditions in the broader system. For example, high product quality cannot translate into economic strength without market access, competitive pricing, logistics, and policy stability. This systems-based observation aligns with the logic of structural and institutional economics, which argues that development is path-dependent and shaped by multiple interlocking dimensions rather than singular shocks or interventions. The model therefore highlights the importance of complementarity among factors: productivity gains must interact with domestic and international market flows, while policy must facilitate allocation of resources, protection of investment, and mitigation of market failures.
Second, the results indicate that temporal, spatial, and demographic variability significantly influence economic performance. In the model, the flow function is explicitly conditioned by time (seasonal cycles, short vs. long-run dynamics), place (local, national, or international markets), and customer characteristics (income level, demographic composition, cultural preference). This result resonates with empirical findings in regional and development economics, where performance varies across territories due to resource availability, infrastructure, institutional capacity, and demand heterogeneity. Weaver (1993) demonstrated that export performance and growth differ across national contexts depending on external demand, internal constraints, and structural preparedness, illustrating how geographical variation shapes economic trajectories. Similarly, demographic economics emphasizes that demand patterns shift with population age structure, income distribution, and consumption preferences, affecting the magnitude and elasticity of market flows. The framework underscores that economic systems are not temporally uniform or spatially homogeneous, meaning actors—whether firms or governments—must adapt strategies to evolving temporal market cycles, geographic constraints, and evolving consumer needs.
Third, the model demonstrates that negative constraints must be actively addressed because they exert downward pressure on growth momentum. The vector incorporates high costs, logistical inefficiencies, market risks, demand volatility, and external shocks—including inflation, financial crises, or geopolitical instability. These variables contribute to economic friction, reducing the effective output of positive growth drivers. Even if productive capacity and market demand expand, increases in costs, bottlenecks, or uncertainty can neutralize these gains. This result aligns with structural constraint theories in development economics, which argue that infrastructure gaps, institutional rigidities, and volatility impose ceilings on growth potential, particularly in developing economies. The symbolic subtraction term within the model emphasizes that constraints increase as a weighted function of contextual friction, implying the arithmetic of development includes both additive growth forces and subtractive obstacles. Therefore, economic improvement depends not only on amplifying positive forces but also on mitigating or eliminating persistent constraints.
Fourth, the model highlights that policy optimization significantly influences economic outcomes. The relationship between , , , and implies a strategic control problem: governments or institutional actors can maximize economic performance by increasing the magnitude of positive drivers , reducing constraints , and improving the efficiency of flow dynamics through better infrastructure, market access, and temporal coordination. Policy levers may include regulatory reforms, trade agreements, logistics development, workforce training, technology upgrading, institutional strengthening, and stabilization mechanisms against external shocks. The model therefore suggests that policy success derives not from isolated interventions but from coordinated optimization across multiple dimensions.
Collectively, these results reinforce the argument that economic development is a systemic outcome generated by interactions among growth forces, constraints, and adaptive flow dynamics. The symbolic structure of Economics Equation–3 offers a concise representation of these interactions and provides a foundation for analytical, empirical, and simulation-based extensions in future research.
The resulting model yields several structural insights:
Economic growth emerges from interaction, not isolation: Improvement in a single variable (e.g., product quality) is insufficient without market access, policy support, and cost efficiency.
Temporal, spatial, and demographic variability matter: Performance changes with seasons, geographic markets, and customer income levels—consistent with multi-dimensional growth studies (Weaver, 1993).
Negative constraints must be addressed: High costs, logistical bottlenecks, risks, and shocks reduce growth momentum, aligning with structural constraint theories.
Policy optimization influences outcomes: Equation terms imply governments can maximize by maximizing , minimizing , and optimizing .
4. Discussion
The results derived from the Economics Equation–3 framework reinforce the idea that economic development is neither linear nor deterministic, but rather emerges from the coordinated interaction of multiple components operating under dynamic conditions. This perspective aligns closely with evolutionary economic theory, which conceptualizes development as a cumulative process characterized by feedback loops, adaptive behavior, and structural change (Dopfer, 2005). Instead of examining isolated causal factors—such as capital, labor, or productivity—the model emphasizes that economic outcomes result from systemic relationships between enabling factors, market flow dynamics, and limiting constraints. This systems-oriented logic challenges traditional reductionist approaches and provides a more realistic representation of how real economies evolve over time.
A central insight from the framework is that strong economies emerge when positive forces (A) expand more rapidly than negative constraints (C), and when market flow (F) remains flexible and responsive to temporal, spatial, and demographic variation. In practical terms, this means that policy efforts aimed solely at enhancing production capacity or improving product quality will not achieve optimal results if logistical bottlenecks, demand volatility, or external shocks remain unaddressed. Conversely, reducing structural constraints without investing in productive capacity will also fail to generate meaningful growth. The model therefore supports an integrated development strategy that simultaneously strengthens productive assets, minimizes constraints, and improves market connectivity.
The incorporation of time, place, and customer characteristics into the flow function reflects an interdisciplinary understanding of economic performance. Time introduces economic cycles, seasonal effects, and long-term transition paths; place introduces spatial heterogeneity, infrastructure differences, and global integration; and customer characteristics introduce preferences, purchasing power, and social stratification. Recognizing these dimensions extends the model beyond traditional macroeconomic abstractions and aligns it with contemporary development literature that emphasizes contextual variability and market segmentation (Petrakis, 2020). Such an approach also holds relevance for firms and industries operating in competitive markets where adaptation to consumer behavior and geographic conditions is essential for survival and growth.
The symbolic and mathematical nature of the model offers advantages for future analytical and empirical extensions. By formalizing the interactions among variables, the framework encourages computational simulation and quantitative sensitivity analysis. This aligns with the broader tradition in economics that views mathematical models as tools for testing theoretical consistency, generating predictions, and exploring counterfactual scenarios (Debreu, 1984). Vasconcelos (2013) demonstrated the value of symbolic and numerical computation in exploring growth trajectories, reinforcing the idea that conceptual economic models can serve as foundations for more detailed numerical analysis. In this sense, the Economics Equation–3 framework provides a conceptual seed that could be operationalized using empirical data, agent-based modeling, or system dynamics simulations.
Finally, the model carries implications for policy design and strategic planning. Governments and institutions can use the framework to identify leverage points where interventions yield the highest returns—such as improving logistics infrastructure, supporting workforce development, or mitigating risks associated with shocks and uncertainty. Because the model distinguishes between growth drivers and constraints, it allows policymakers to target both sides of the development equation. In addition, the emphasis on flow dynamics highlights the importance of aligning production with market reality rather than treating them as separate spheres.
In summary, the Economics Equation–3 framework enriches the conceptual landscape of development economics by bridging systems thinking, mathematical representation, and evolutionary theory. While conceptual and not empirical, it offers a structured basis for future modeling, calibration, and policy-oriented research.
The model supports the notion that economic development is a systemic process shaped by complex interactions, consistent with evolutionary and interdisciplinary frameworks (Dopfer, 2005; Petrakis, 2020). It emphasizes that strong economies emerge when positive forces expand faster than constraints, and when market flow remains adaptive to time, location, and demand. The symbolic approach encourages future numerical calibration and simulation, aligning with the mathematical modeling traditions highlighted by Vasconcelos (2013) and Debreu (1984).
5. Conclusion
The Economics Equation–3 framework presented in this study offers a conceptual and symbolic approach to understanding how economic strength emerges from the interaction among productive forces, market flow dynamics, and negative constraints. Rather than attributing development to a single factor, the model emphasizes the need for alignment between growth-supporting variables—such as product quality, workforce capacity, and policy support—and adaptive market mechanisms shaped by time, location, and customer characteristics. At the same time, the model acknowledges that high costs, logistical bottlenecks, volatility, and systemic shocks exert downward pressure on growth outcomes. The resulting economic performance depends on the degree to which positive drivers expand faster than limitations.
Although theoretical in nature, the model holds value for policy makers, businesses, and academic researchers. For policy makers, it provides a structured means of identifying leverage points for intervention, allowing governments to enhance productive capacity while minimizing structural barriers and external vulnerabilities. For firms and industries, the framework highlights the importance of integrating production strategies with market conditions rather than treating them as isolated domains. For academic researchers, the symbolic configuration creates opportunities for analytical refinement, mathematical formalization, and interdisciplinary dialogue between economics, systems science, and quantitative modeling.
Future research can advance the framework by operationalizing it in several directions. One promising avenue is empirical calibration using sectoral or national datasets to test the sensitivity of performance outcomes to different configurations of productive factors, market flows, and constraints. Another direction involves simulation-based approaches, such as system dynamics or agent-based modeling, which can explore nonlinear trajectories and adaptive behavior under varied policy scenarios. Comparative research across countries or industries may also yield insights into how structural heterogeneity shapes the model’s parameters and predictive reliability.
In summary, Economics Equation–3 provides a foundational conceptual system that invites further development, empirical testing, and policy-oriented application in the field of economic growth and development..
References
Mashrafi, M. (2026). Universal Life Energy–Growth Framework and Equation. International Journal of Research, 13(1), 79-91.
Mashrafi, M. (2026). Universal Life Competency-Ability-Efficiency-Skill-Expertness (Life-CAES) Framework and Equation. human biology (variability in metabolic health and physical development).
Fusfeld, D. R. (1980). The conceptual framework of modern economics. Journal of Economic Issues, 14(1), 1-52.
Vasconcelos, P. B. (2013). Economic growth models: symbolic and numerical computations. Advances in Computer Science: an International Journal, 2(5), 47-54.
Czerwinski, A. (2024). Mathematics serving economics: a historical review of mathematical methods in economics. Symmetry, 16(10), 1271.
Weaver, J. H. (1993). Exports and economic growth in a simultaneous equations model. The Journal of Developing Areas, 27(3), 289-306.
Debreu, G. (1984). Economic theory in the mathematical mode. The American Economic Review, 74(3), 267-278.
Dopfer, K. (2005). Evolutionary economics: a theoretical framework. The evolutionary foundations of economics, 3-55.
Petrakis, P. E. (2020). Theoretical approaches to economic growth and development. An Interdisciplinary Perspective. Switzerland: National and Kapodistrian University of Athens, 26-544.
Debreu, G. (1989). Theoretic models: mathematical form and economic content. In Joan Robinson and Modern Economic Theory (pp. 264-277). London: Palgrave Macmillan UK.
Ramkissoon, H. (2015). Authenticity, satisfaction, and place attachment: A conceptual framework for cultural tourism in African island economies. Development Southern Africa, 32(3), 292-302.
Ghadim, A. K. A., & Pannell, D. J. (1999). A conceptual framework of adoption of an agricultural innovation. Agricultural economics, 21(2), 145-154.
Mashrafi, M. (2026). Domain-Dependent Validity of an Inequality Derived from a Classical Absolute Value Identity. International Journal for Social Studies, 12(1), 32–42. https://doi.org/10.26643/ijss/2026/2
Mokhdum Mashrafi (Mehadi Laja) Research Associate, Track2Training, India Researcher from Bangladesh Email: mehadilaja311@gmail.com
Abstract
The classical identity √(−Y)² = |Y| is universally valid for all real Y, arising from the principal square root and absolute value definitions. However, when this identity is reformulated as an inequality—namely √(−Y)² ≤ Y—its validity becomes domain-restricted rather than universal. This paper provides a rigorous analytical examination of the inequality and demonstrates that it holds if and only if Y ≥ 0. For Y < 0 the inequality fails due to the non-negativity constraint imposed by the principal square root. The results highlight that transforming universally valid equalities into inequalities introduces implicit logical constraints not visible in the original formulation. The findings underscore the importance of explicit domain awareness in algebraic reasoning, inequality analysis, and pedagogical practice.
In elementary algebra and real analysis, one encounters a variety of foundational identities that appear deceptively simple yet encode nontrivial conceptual structures. Among these, the identity involving the principal square root of a squared real number, expressed in the canonical form √Y² = |Y|, occupies a central role in the theory of real-valued functions. This identity asserts that for any real number Y, applying the squaring operation followed by the principal square root yields the absolute value of Y rather than its original signed value. This result follows directly from two fundamental conventions: first, that the square of a real quantity is always non-negative; and second, that the principal square root function √· is defined to produce the unique non-negative real number whose square equals the input. Together, these conventions enforce that √Y² is never negative, even when Y itself is negative, thereby establishing equality with |Y| rather than Y.
The identity plays a crucial role in various branches of mathematics, including algebraic manipulation, analytic proofs, metric theory, inequality systems, vector calculus, and optimization frameworks. Students typically learn to apply this identity when simplifying radical expressions, solving equations involving absolute values, or analyzing distance functions in Euclidean space. Despite its ubiquity, the pedagogical presentation of this identity is often terse, leaving little room for discussing conceptual subtleties such as the principal value convention, the distinction between signed and unsigned magnitudes, or the domain-sensitive implications of logical transformations involving equalities and inequalities.
A particularly underexplored aspect arises when one considers not merely the identity itself, but transformations that involve replacing the equality sign with inequality symbols. In mathematical analysis, it is common to convert identities into inequalities when considering bounding relationships, constraint satisfaction, feasibility regions, or optimization criteria. Such transformations appear simple at first glance, yet they may introduce implicit logical restrictions on variable domains that are not evident in the original identity. For example, one might ask whether the expression √Y² ≤ Y holds for all real Y, or equivalently whether |Y| ≤ Y is universally valid. While the original equality √Y² = |Y| holds for every real number, the transformed inequality does not: it is satisfied only for non-negative values of Y. For negative values of Y, the expression fails, because |Y| becomes strictly greater than Y, reflecting the fact that the absolute value function removes sign rather than preserving it.
This observation illustrates a deeper conceptual phenomenon in mathematics: equalities can be logically symmetric and universally valid across entire domains, whereas inequalities typically encode asymmetric relations that depend critically on the sign, order, or domain of the variable. When transforming an equality into an inequality, one may unintentionally impose additional constraints that were absent in the original formulation. In the case of √Y² = |Y|, the identity is unconditional, and no assumptions about the sign of Y are required. However, the inequality √Y² ≤ Y implicitly demands that Y be non-negative, since √Y² represents a non-negative quantity while Y may take negative values. Thus, the inequality is neither universally valid nor equivalent to the original identity, but instead defines a proper subset of the real number system—namely the set of all Y such that Y ≥ 0.
The distinction between these two statements underscores the importance of domain awareness in algebraic reasoning. In textbooks and classroom instruction, students are rarely encouraged to interrogate domain restrictions unless explicitly solving inequalities or piecewise-defined functions. However, understanding when and why domain restrictions emerge is critical not only for higher mathematics, but also for applied fields such as optimization, control theory, computational modeling, and machine learning, where constraints and feasibility sets determine the correctness of solutions.
From a logical and pedagogical standpoint, the inequality-based interpretation of √(−Y)² is especially intriguing. One might initially assume that since squaring removes sign information and the square root function returns a non-negative output, the expression √(−Y)² is algebraically interchangeable with √Y². Indeed, in terms of algebraic value, both reduce to |Y| without exception. Yet, when comparing √(−Y)² directly to Y rather than |Y|, the sign of Y becomes decisive. For Y ≥ 0, both √Y² and Y yield the same non-negative value, and the inequality √(−Y)² ≤ Y is satisfied as an equality. For Y < 0, however, the expression √(−Y)² equals −Y, which is strictly positive, while Y itself is negative; hence the inequality fails. This introduces a stark boundary at zero, revealing that what was once an unconditional equality can become a conditional statement partitioning the real line into validity and invalidity regions.
This study focuses precisely on these logical and domain-sensitive implications. By examining the expression √(−Y)² and its relational comparison with Y through the inequality √(−Y)² ≤ Y, the work aims to clarify how subtle domain conditions emerge from inequality reformulation. Although √(−Y)² equals |Y| algebraically, the inequality introduces a nontrivial domain constraint dependent on the sign of Y. Through formal characterization, this analysis demonstrates that such transformations are not merely symbolic exercises, but encode structural truths about real-number operations, sign behavior, and the semantics of comparison operators.
The broader significance lies in reinforcing a more rigorous culture of algebraic thinking. Mathematics is full of statements that appear obvious in one form yet reveal deeper layers when expressed differently. By making these layers explicit, we gain more refined tools for both teaching and research, encouraging learners to transition from procedural manipulation to conceptual understanding. The exploration presented here is therefore not merely a technical exercise, but an illustration of how foundational algebraic concepts can continue to yield insights when viewed through new interpretive lenses.
2. Methods
Figure 1: Analytical framework
The analytical framework employed in this study draws upon foundational concepts from real analysis, algebraic logic, and inequality theory. The objective of the methodological approach is to determine the domain-specific conditions under which the inequality holds, despite the universal validity of the underlying identity . The approach proceeds through three interconnected methodological components, each of which contributes to a rigorous evaluation of domain-sensitive validity.
1. Absolute Value Theory
The starting point of the analysis relies on the theoretical definition of the absolute value function. For any real number , the absolute value is defined piecewise as:
This definition encapsulates the notion that absolute value represents magnitude without sign. In the context of the present study, the expression reduces directly to , which provides a bridge between radical expressions and piecewise-defined functions. By introducing this piecewise structure, the method explicitly anticipates that different domain intervals (such as and ) will exhibit different behaviors with respect to the target inequality.
2. Principal Square Root Properties
The second methodological component involves formal properties of the principal square root operator , which is defined to yield the non-negative real number whose square equals the argument. This definition is essential because it ensures for all . In the current context, since squaring eliminates sign, the expression is always non-negative, and thus its principal square root satisfies for every real . This property plays a determinant role when comparing with , because if , the left-hand side becomes non-negative while the right-hand side becomes strictly negative, creating an inherent asymmetry.
3. Inequality Reformulation and Case-Based Evaluation
The final component reformulates the inequality analytically. Using the equality , the target inequality becomes . Since is piecewise-defined, the inequality must be evaluated separately for the intervals and . This case-based evaluation allows the study to determine precisely where the inequality holds and where it fails, yielding a domain-sensitive conclusion.
Together, these three methodological steps provide a structured and rigorous framework for analyzing domain-dependent validity in algebraic inequalities.
3. Results
3.1 Reformulation
From:
the inequality becomes:
The first step in the analytical process involves rewriting the given radical expression in a form that reveals its algebraic structure more transparently. Starting from the expression , we note that it follows the same transformation principle as the more common form . In both cases, the squaring operation eliminates the sign information of the inner quantity, producing a non-negative result, and the principal square root operator returns the non-negative magnitude. This allows us to invoke the well-established identity for any real number . Accordingly, if we treat as the inner argument, its squared value will be non-negative, and therefore . When the specific expression simplifies to , the identity becomes , reflecting the magnitude of independently of its sign. This reformulation bridges radical expressions with absolute value theory and sets the stage for inequality-based reasoning.
Once the radical expression has been converted into absolute value notation, the inequality under study becomes significantly more tractable. The original inequality involving the square root can now be expressed in terms of absolute values as . This transformation is crucial for two reasons. First, it replaces a radical expression with a piecewise-defined function, which naturally leads to domain-based interpretation. Second, it makes explicit that the analytical challenge is no longer about evaluating a square root, but rather about understanding how the sign of influences the relationship between and . Since the absolute value function either preserves or negates its input depending on its sign, the reformulated inequality highlights that the validity of the original inequality hinges entirely on the sign of . The reformulation therefore serves as a critical methodological link between symbolic manipulation and domain-sensitive inequality analysis.
3.2 Domain Evaluation
Two cases are analyzed:
Case 1: Y ≥ 0 Here |Y| = Y, so the inequality holds as equality.
Case 2: Y < 0 Here |Y| = −Y > Y, so the inequality fails.
After reformulating the expression into the inequality , the next step is to determine the domain over which this inequality holds true. Since the absolute value function is defined in a piecewise manner, its behavior depends on the sign of . Therefore, the evaluation naturally requires a division of the real number line into distinct intervals corresponding to non-negative and negative values of . This case-based approach is essential because the inequality may demonstrate different logical outcomes in each interval, even though the original identity is universally valid over all real numbers.
In the first case, when , the definition of the absolute value function reduces to . Substituting this into the inequality yields , which holds as an equality. Consequently, for all non-negative values of , the original inequality is satisfied. In the second case, when , the definition of absolute value becomes . Since whenever is negative, the substituted inequality becomes , which is false. Thus, no negative value of satisfies the inequality. The case-based evaluation therefore reveals a sharp contrast between positive and negative domains, demonstrating that sign plays a decisive role in the inequality’s validity.
3.3 Final Result
The inequality holds if and only if:
Based on the above domain evaluation, it becomes clear that the inequality — and by extension — is not universally valid over the real numbers. Instead, its validity is restricted to those values of for which the absolute value function does not introduce a sign change. Formally, the inequality holds if and only if . For all values of , the inequality fails because the non-negative output of the principal square root cannot be less than or equal to a negative input.
This result highlights a crucial conceptual conclusion: while algebraic equalities involving radicals and squares can be universally valid, inequalities derived from them may exhibit domain-dependent truth conditions. The sign of the variable becomes the determining factor, turning a seemingly simple expression into a conditional statement about subsets of the real line.
4. Discussion
The results show that converting a universally valid equality into an inequality introduces domain constraints not present in the original expression. The principal square root ensures a non-negative outcome, which creates sign-sensitive relational effects when compared with an unrestricted real variable.
The findings of this study demonstrate that transforming a universally valid algebraic equality into an inequality can fundamentally alter the logical conditions under which the resulting statement remains true. The identity is valid for all real values of because it rests on definitions that apply unconditionally over the real number system: squaring removes sign information, and the principal square root returns the non-negative magnitude of its argument. However, once the equality is reformulated into the inequality , the universal validity disappears. The inequality no longer holds for all ; instead, its validity becomes contingent on the sign of , yielding a domain restriction to . This shift from an unrestricted to a restricted domain illustrates how relational operators such as ≤ or ≥ introduce asymmetry into statements that were originally symmetric under equality.
A key reason for this shift lies in the non-negativity constraint embedded within the principal square root function. The operator is defined to return the unique non-negative real number whose square equals the input. As a result, is always non-negative, while itself may be negative. When the inequality compares a non-negative quantity to a potentially negative one, a sign conflict arises: if , then , making the inequality false. This asymmetry is invisible in the original equality because equality imposes a bidirectional condition of equivalence that is satisfied regardless of sign. In contrast, inequality imposes a directional relation that only holds over a restricted subset of values. The result reinforces the broader principle that inequality reasoning requires more careful attention to sign behavior and functional range than equality reasoning does.
More broadly, this analysis reveals an important conceptual insight: a universally true algebraic identity can become a conditionally true inequality depending on the relational operator and the assumed domain of discourse. This observation is frequently overlooked in routine algebraic instruction, where students learn to manipulate symbols in a procedural manner without explicitly considering domain constraints. For instance, many algebraic techniques—such as applying square roots, dividing by variables, or expanding absolute values—are valid only under certain domain assumptions. When these assumptions remain implicit, errors may arise in both computation and reasoning. The present study highlights the need to make such assumptions explicit, particularly in foundational learning environments.
This insight has practical implications beyond pure algebra. In real analysis, inequalities often act as tools for bounding functions, defining convergence criteria, or establishing continuity and differentiability properties. In optimization and constraint modeling, inequalities define feasible solution spaces, control stability conditions, and determine whether a candidate solution satisfies required constraints. In such contexts, misunderstanding domain restrictions can lead to incorrect feasible sets, invalid assumptions about optimality, or flawed proofs regarding solution existence. Awareness of domain conditions therefore contributes directly to mathematical rigor and theoretical correctness.
The pedagogical implications are equally significant. Modern mathematics education has increasingly emphasized conceptual understanding over mechanical symbol manipulation. Encouraging students to reflect on domain assumptions and the behavior of functions under relational transformation aligns with this goal. By presenting examples such as the inequality derived from , instructors can illustrate how expressions that seem trivial in equality form can become nontrivial when reinterpreted under inequalities. Such instruction fosters more robust logical reasoning and prepares students for advanced topics where domain issues are central, including measure theory, functional analysis, and numerical methods.
Finally, the discussion situates this work within the broader context of algebraic logic. Algebraic expressions are not merely computational artifacts but encode structural relationships governed by definitions, operators, and domains. Recognizing how these components interact is essential to understanding when and why mathematical statements hold. The present study contributes to this understanding by clarifying how the interplay between the principal square root, absolute value, and inequality operators generates domain-sensitive outcomes. Taken together, these observations reinforce that seemingly simple manipulations can have deep logical consequences, and that mathematical rigor requires attention not just to formulas, but to the structural assumptions they implicitly carry.
More broadly, this reveals that:
A universally true equality can yield a conditionally true inequality depending on the relational operator and domain assumptions.
This insight is relevant in real analysis, constraint modeling, and mathematical pedagogy, where rigor and domain awareness are crucial. Highlighting such constraints supports conceptual understanding and discourages overly procedural manipulation without logical interpretation.
5. Conclusion
The inequality derived from the classical identity holds only for non-negative values of Y. While the equality form is valid for all real numbers, the inequality form becomes domain-restricted. This demonstrates the importance of recognizing implicit logical constraints when performing algebraic transformations involving inequalities.
This study examined the inequality obtained from a classical algebraic identity and demonstrated that its validity is restricted to a subset of the real number system. While the underlying equality holds universally for all real values of , the derived inequality is satisfied only when . For , the inequality fails due to the non-negativity of the principal square root, which produces values that cannot be less than or equal to negative quantities. This contrast highlights a key conceptual point: equality-based identities may retain validity over entire domains, whereas their inequality counterparts may introduce implicit restrictions that alter the set of permissible input values.
The results emphasize the importance of recognizing and articulating domain assumptions when performing algebraic transformations, particularly those involving inequalities and absolute values. Failure to acknowledge such constraints can lead to incorrect conclusions, especially in contexts involving optimization, analysis, and proof-based reasoning. By making these logical boundaries explicit, this work contributes to a deeper understanding of how structural properties of functions shape mathematical statements, and it underscores the pedagogical value of treating equalities and inequalities not as interchangeable symbolic forms, but as distinct logical objects with different domain implications.
References
Mashrafi, M. (2026). Universal Life Energy–Growth Framework and Equation. International Journal of Research, 13(1), 79–91.
Mashrafi, M. (2026). Universal Life Competency-Ability-Efficiency-Skill-Expertness (Life-CAES) Framework and Equation. Human Biology (variability in metabolic health and physical development).
Lamberti, P. D., & de Cristoforis, M. L. (2005). A global Lipschitz continuity result for a domain-dependent Neumann eigenvalue problem for the Laplace operator. Journal of Differential Equations, 216(1), 109–133.
Finnie, G., & Sun, Z. (2002). Similarity and metrics in case‐based reasoning. International Journal of Intelligent Systems, 17(3), 273–287.
Harari, I., & Hughes, T. J. (1992). What are C and h?: Inequalities for the analysis and design of finite element methods. Computer Methods in Applied Mechanics and Engineering, 97(2), 157–192.
Segu, M., Tonioni, A., & Tombari, F. (2023). Batch normalization embeddings for deep domain generalization. Pattern Recognition, 135, 109115.
Huo, T., et al. (2025). A novel domain generalization network integrating invariance and cohesiveness for rolling bearing fault diagnosis. Structural Health Monitoring.
Vänskä, S., & Taskinen, M. (2008). Domain dependent Dirac’s delta and derivatives with an application to electromagnetic boundary integral representations. Journal of Mathematical Analysis and Applications, 344(1), 546–556.
Schatz, A. H. (1980). A weak discrete maximum principle and stability of the finite element method in . Mathematics of Computation, 34(149), 77–91.
Dun, A., Geng, Z., & Huang, L. (2011). Design of controller for Lur’e systems guaranteeing dichotomy. Applied Mathematics and Computation, 217(22), 8927–8935.
Long, M., Wang, J., Sun, J., & Yu, P. S. (2014). Domain invariant transfer kernel learning. IEEE Transactions on Knowledge and Data Engineering, 27(6), 1519–1532.
Tseng, V. S., Chen, L. C., & Kao, C. P. (2008). Constrained clustering for gene expression data mining. In PAKDD (pp. 759–766). Springer.
Mashrafi, M. (2026). Plants as Responsive Biological Systems: Integrating Physiology, Signalling, and Ecology- The Hidden Emotions of Plants: The Science of Pleasure, Pain, and Conscious Growth. International Journal of Research, 13(1), 543–559. https://doi.org/10.26643/ijr/2026/26
Plants have historically been viewed as passive biological entities lacking sensation, emotion, or intelligence. Advances in plant physiology, electrophysiology, ecology, and bio-interfacing, however, reveal a vastly more complex picture. Plants perceive a wide spectrum of environmental cues, generate electrical and chemical signaling networks, and exhibit adaptive behaviors analogous to learning, memory, decision-making, and stress responses. While these processes do not constitute emotions in the human or animal sense, they represent a functional system of growth-mediated responsiveness that advances survival and environmental attunement. This paper synthesizes emerging research across plant signaling, sensory ecophysiology, distributed intelligence, and human–plant interaction design to explore how plants experience and respond to the world. By integrating biological mechanisms with philosophical perspectives on consciousness and affect, it proposes a framework for understanding plants as responsive biological systems embedded within ecological and relational contexts. The goal is not to anthropomorphize plant life but to expand scientific language beyond outdated binaries and acknowledge plants as dynamic participants in biospheric intelligence.
Plants have long been regarded as passive, insentient organisms governed purely by biochemical growth processes and environmental constraints. This perception was reinforced by anthropocentric criteria for sensation and emotion, which equated subjective experience with the presence of a nervous system or centralized brain structures (Hamilton & McBrayer, 2020). Yet research over the past decades in plant physiology, electrophysiology, behavioral ecology, and philosophy of biology increasingly challenges this framework, suggesting that plants possess sophisticated systems of perception, response, and adaptive regulation (Trewavas, 2014; Gagliano et al., 2017).
Contemporary plant science describes plants as organisms that continuously sense and integrate environmental variables such as light spectrum, gravity, mechanical stress, volatile chemicals, temperature, soil moisture, nutrient availability, and biotic threats. These stimuli are processed through interconnected networks of hormones, ion channels, electrical signaling, biomechanical feedback, and gene regulation (Panda et al., 2025). Many of these mechanisms produce context-dependent and graded responses—properties associated with adaptive decision-making rather than simple reflex arcs.
Electrical signaling in plants provides one of the most compelling lines of evidence. Variation potentials and action potentials propagate systemic information following herbivore attack, injury, or environmental shifts, enabling coordinated physiological responses (Debono & Souza, 2019). While not homologous to animal neural pathways, these signals demonstrate that plants maintain internal communication architectures capable of rapid modulation and systemic integration. Combined with volatile organic compound (VOC) exchange, plants also communicate with neighboring individuals, warn others of danger, and recruit mutualistic organisms—behaviors once thought exclusive to animals (Myers, 2015).
From a sensory perspective, plants demonstrate remarkable perceptive sophistication. Photoreceptors detect light intensity, wavelength, duration, direction, and periodicity, shaping circadian regulation, flowering, morphogenesis, and pigmentation strategies. Floral coloration, fragrance, and nectar production represent energetically costly signaling systems that mediate ecological relationships, particularly through co-evolution with pollinators (Calvo, 2017). These systems imply a form of environmental modeling that expresses itself through growth, chemical output, and allocation of metabolic resources.
The question of whether plants feel or experience pain has generated philosophical debate. While plants lack neurons and nociception pathways, some scholars argue that sensory processing and defensive responses reflect a non-neural form of affective adaptation (Hamilton & McBrayer, 2020). Neuroscientific perspectives caution, however, that pain as an emotion must remain linked to conscious perception and affective circuitry (LeDoux, 2012), prompting the need to distinguish between functional analogs and subjective experience.
Human–plant interaction research is beginning to incorporate these findings into applied contexts. Novel interfaces and bi-directional feedback systems seek to cultivate empathy and pro-environmental behavior by visualizing plant responses and communication signals (Luo et al., 2025). Philosophical and artistic explorations further highlight the conceptual challenges involved in understanding plant perspectives and sensory modalities (Gagliano et al., 2017).
To contextualize plant responsiveness within broader biological theory, recent contributions in systems biology emphasize competencies, efficiency, and energetic dynamics as universal organizing principles across life forms (Mashrafi, 2026a; Mashrafi, 2026b). This approach supports the idea that plant awareness and adaptive intelligence emerge not from neural processing, but from distributed physiological control embedded in metabolic and ecological networks.
Recognizing plants as responsive, communicative, and adaptive organisms does not require attributing human-like consciousness or emotional pain. Instead, it invites a shift toward viewing plants as participants in a continuum of biological intelligence, distinguished by their growth-based, decentralized mode of interaction with the world. This paper therefore examines the sensory, signaling, and adaptive dimensions of plant life; articulates distinctions between empirical evidence and metaphor; and explores how integrating physiology, signaling, and ecology reveals a hidden emotional–responsive dimension of plant existence.
1. The Functional–Emotional Structure of Plants
Bioelectric Signaling, Sensory Integration, and Reproductive Responsiveness
Plants do not possess centralized nervous systems or brains; however, this absence does not imply the absence of internal signaling, coordination, or adaptive responsiveness. Modern plant physiology demonstrates that plants operate through distributed bioelectrical, biochemical, and hormonal networks that enable long-distance communication between roots, stems, leaves, and reproductive organs. These networks allow plants to detect environmental cues, integrate information, and generate context-dependent responses essential for survival and reproduction.
At the electrophysiological level, plants generate action potentials and variation potentials—measurable electrical signals propagated through vascular tissues such as the phloem. Although these signals travel more slowly than animal neural impulses, they serve analogous systemic functions: transmitting information about mechanical stress, injury, hydration status, and reproductive readiness. These bioelectric signals regulate gene expression, hormone distribution, and metabolic allocation, functioning as a decentralized information-processing system rather than reflexive chemistry alone.
Reproductive biology provides a particularly compelling demonstration of plant sensory and response capacity. In dioecious and functionally separated reproductive systems—such as those observed in Carica papaya—successful fruit formation depends on precise synchronization between male pollen release and female floral receptivity. This synchronization is mediated by chemical signaling (volatile organic compounds), photoperiod sensitivity, temperature thresholds, and pollinator-mediated feedback loops. Floral structures emit species-specific chemical and spectral cues that attract pollinators, while receptive tissues undergo transient physiological changes that enable fertilization only within optimal time windows.
These processes do not require conscious intention, yet they reflect selective responsiveness rather than mechanical inevitability. The plant’s reproductive system actively discriminates between compatible and incompatible signals, adjusts investment based on environmental conditions, and reallocates energy toward growth, defense, or reproduction depending on internal and external feedback. In functional terms, this resembles biological “preference” or “valuation,” though expressed through growth modulation and biochemical thresholds rather than subjective experience.
From a systems perspective, pollination can be understood as an information-matching process rather than a passive event. The presence of male and female structures alone is insufficient; successful fertilization requires signal recognition, temporal alignment, and physiological readiness. These conditions imply that plants possess sensory thresholds, activation states, and adaptive response mechanisms—features characteristic of responsive living systems across biological kingdoms.
Importantly, describing these processes as forms of “plant emotion” does not imply that plants experience pain, pleasure, or desire in the human or animal sense. Instead, it reflects a broader scientific reinterpretation of emotion as organized biological responsiveness to internal needs and external stimuli. In this framework, emotion is not defined by consciousness alone but by function: the capacity to detect significance, prioritize responses, and regulate behavior toward continuation of life.
Thus, plant reproduction—particularly pollination-dependent fruiting—demonstrates that plants are not inert entities but active participants in ecological communication networks, operating through electrical signaling, chemical attraction, and adaptive growth regulation. Their “emotional structure,” when defined scientifically, resides not in feeling as humans feel, but in the integrated signaling architectures that guide survival, reproduction, and evolutionary success.
2. Pleasure, Pain, and Communication Plant Perception, Stress Signaling, and Adaptive Response Systems
Plants lack neurons and centralized brains, yet they exhibit rapid, coordinated responses to environmental stimuli that require perception, signal transduction, and systemic integration. One of the most extensively studied examples is Mimosa pudica, commonly known as the “touch-me-not” plant. When mechanically stimulated, its leaflets fold within seconds—a response driven by mechano-electrical signal transduction rather than simple reflexive motion. Mechanical pressure triggers ion fluxes, particularly potassium and calcium, leading to rapid changes in turgor pressure within specialized motor cells (pulvini). This response is repeatable, reversible, and stimulus-dependent, demonstrating that plants can detect external signals and convert them into organized physiological action.
Electrophysiological studies confirm that Mimosa pudica generates action potentials that propagate through vascular tissues following touch, heat, or injury. These electrical signals share fundamental properties with animal action potentials—threshold activation, all-or-none behavior, and signal propagation—though they occur at slower speeds and serve decentralized regulatory roles. Such signaling enables the plant to distinguish between harmless and potentially damaging stimuli, indicating perception rather than random reaction.
Beyond mechanical sensing, plants respond to tissue damage through a suite of systemic wound signals involving electrical impulses, calcium waves, hydraulic pressure changes, and phytohormone cascades (notably jasmonates and ethylene). When a leaf is cut, burned, or attacked by herbivores, these signals spread rapidly throughout the plant, activating defense genes, altering metabolism, and reallocating resources. While this process is not “pain” in the neurological sense, it is functionally analogous to nociception—the detection and response to harmful stimuli—widely recognized in animals and increasingly discussed in plants as a defensive sensory capacity.
Plant communication extends beyond internal signaling to inter-plant and ecosystem-level information exchange. Plants release volatile organic compounds (VOCs) in response to stress, which neighboring plants can detect and respond to by preemptively activating defense mechanisms. These chemical messages function as early-warning systems and contribute to collective resilience within plant communities. Additionally, plants exhibit synchronized electrical and biochemical signaling when growing in proximity, mediated through soil networks, root exudates, and mycorrhizal associations. Although these interactions are sometimes described metaphorically as “emotional” or “vibrational,” scientifically they represent low-frequency biological signaling and chemical information transfer, not conscious communication.
Environmental favorability also elicits measurable internal changes in plants. Optimal light spectra, adequate water availability, and sufficient mineral nutrition lead to increased photosynthetic efficiency, hormonal balance, cell division, and biomass accumulation. Under deprivation—such as prolonged darkness, drought, or nutrient deficiency—plants exhibit stress physiology: reduced growth rates, altered gene expression, oxidative stress, and eventual senescence. These transitions reflect state-dependent physiological regulation, not subjective pleasure or suffering, but they parallel the functional role emotions play in animals: signaling internal conditions and guiding adaptive responses.
Crucially, modern plant science distinguishes between sentience and sensitivity. Plants do not possess consciousness or emotional experience as humans or animals do; however, they are highly sensitive biological systems capable of perceiving stimuli, prioritizing responses, and modifying future behavior based on past exposure. Memory-like effects—such as habituation in Mimosa pudica, where repeated non-harmful stimuli result in diminished response—demonstrate that plant signaling is context-aware and adaptive rather than purely mechanical.
In this scientific framework, “pleasure” and “pain” serve as metaphors for growth-promoting versus stress-inducing physiological states. Plants shift dynamically between these states through integrated electrical, chemical, and metabolic signaling networks. The transition from vigorous growth to decline—from bloom to senescence—is governed by internal feedback mechanisms that continuously evaluate environmental conditions and energetic viability.
Thus, plant behavior reveals not emotion in the human sense, but a distributed biological intelligence—one that enables perception, communication, and adaptive regulation without a nervous system. Recognizing this complexity expands our understanding of life as a continuum of responsive systems, rather than a hierarchy divided sharply between “feeling” and “non-feeling” organisms.
3. Color and Feeling in Nature
Optical Signaling, Physiological State, and Ecological Communication in Plants
Color in nature is not merely decorative or aesthetic; it is a biologically functional signal that conveys information about physiological state, metabolic activity, and ecological intent. In plants, coloration arises from the controlled synthesis, degradation, and spatial distribution of pigments such as chlorophylls, carotenoids, and anthocyanins. These pigments do not appear randomly. Their presence, absence, or transformation reflects tightly regulated biochemical processes responding to environmental conditions and internal energy balance.
In flowers, bright colors—such as yellow, red, blue, or ultraviolet-reflective patterns—serve as reproductive communication signals. These colors are tuned to the visual systems of pollinators and often coincide with nectar production, fragrance emission, and optimal pollen viability. For example, yellow floral pigmentation commonly results from carotenoids, which are energetically costly to synthesize and therefore reliably signal reproductive fitness. In this context, color functions as an attraction signal, enhancing pollination success and genetic continuation.
By contrast, when similar yellow coloration appears in leaves, it frequently indicates chlorophyll degradation, reduced photosynthetic capacity, or nutrient deficiency—most notably nitrogen, magnesium, or iron shortage. This process, known as chlorosis, reflects a shift from growth-oriented metabolism toward stress response or senescence. The same pigment family that signals vitality in flowers thus signals physiological decline in foliage, depending on location, timing, and tissue function. This context-dependence demonstrates that plant color operates as a state-dependent information system, not a static visual trait.
During seasonal transitions, such as autumnal senescence, green chlorophyll breaks down, revealing underlying carotenoids and anthocyanins. This color transformation is associated with nutrient reabsorption, oxidative stress management, and controlled tissue aging. Far from being passive decay, senescence is an actively regulated developmental phase, orchestrated through gene expression and hormonal signaling. Color change here marks a transition in the plant’s internal state—from active carbon acquisition to resource conservation and survival.
From an ecological perspective, color also plays a defensive and communicative role. Certain pigment changes deter herbivores, signal toxicity, or reduce photodamage under excessive light. Anthocyanin accumulation, for example, can protect tissues from oxidative stress and ultraviolet radiation while simultaneously altering visual appearance. Neighboring organisms—pollinators, herbivores, or even other plants—respond differently to these visual cues, integrating color into broader ecological feedback loops.
Although it is tempting to describe these color changes as expressions of “mood” or “emotion,” a scientifically precise interpretation frames them as optical manifestations of physiological condition. In animals, emotions serve to integrate internal states with external behavior; in plants, pigment-driven color shifts fulfill an analogous functional role by signaling internal status and guiding ecological interaction—without implying consciousness or subjective feeling.
Thus, color in plants can be understood as a biochemical language—one that reveals health, stress, reproductive readiness, and developmental phase. The same wavelength may signify attraction or distress depending on tissue type and physiological context. This duality underscores that plant coloration is not symbolic but informational, translating metabolic processes into visible signals that regulate interaction with the environment.
In this scientifically grounded sense, color functions as a bridge between internal plant physiology and external ecological communication. It reflects how plants “experience” favorable or unfavorable conditions—not through emotion as humans define it, but through precisely regulated biological responses that make their internal state visibly legible to the living world around them.
4. Light, Energy, and the Integrative Environmental “Master Force”
Photobiology, Temporal Rhythms, and Systems-Level Regulation of Plant Life
In classical physics, the speed of light in vacuum is constant, a principle confirmed by extensive experimental evidence and fundamental to modern physics. However, biological systems do not respond to light solely as a fixed-speed physical constant. Instead, living organisms—particularly plants—respond to light as structured energy, characterized by wavelength, intensity, duration, periodicity, and directional coherence. It is these dynamic properties of light, rather than its velocity, that drive seasonal variation and biological differentiation.
Plants do not measure light in meters per second; they measure it in time, frequency, and spectral composition. This distinction explains why long-day and short-day plants respond differently under what appears to be the same sunlight intensity. The key factor is photoperiodism—the biological response to the relative length of day and night—mediated by internal molecular clocks synchronized with environmental light–dark cycles. Even when total sunlight energy is similar, changes in day length alter gene expression, hormone production, and developmental pathways.
At the molecular level, plants possess specialized photoreceptors (such as phytochromes and cryptochromes) that detect specific light wavelengths and convert them into biochemical signals. These signals regulate flowering time, stem elongation, leaf expansion, and dormancy. Importantly, plants measure night length, not day length—a clear indication that biological timekeeping, rather than raw light intensity, governs developmental decisions. This reveals light as a temporal signal as much as an energy source.
From a physical perspective, light exhibits wave–particle duality, meaning it carries energy in discrete quanta while propagating as oscillating electromagnetic waves. Plants are exquisitely tuned to these oscillatory properties. The rhythmic absorption of photons entrains circadian clocks, aligns metabolic cycles, and synchronizes growth with seasonal and planetary rhythms. In this sense, life responds not to static illumination but to structured oscillations embedded in the environment.
The concept I describe as a “Master Force” can be scientifically reframed as the integrated field of environmental rhythms—a convergence of solar radiation cycles, Earth’s rotation, orbital dynamics, atmospheric circulation, and electromagnetic energy flow. Together, these factors create predictable patterns in light availability, temperature, humidity, and wind. Plants evolve within this rhythmic framework and depend on it for survival. Growth, flowering, senescence, and stress responses all emerge from continuous interaction with these coupled environmental oscillations.
Wind patterns influence transpiration and gas exchange; light cycles regulate photosynthesis and hormonal timing; temperature gradients affect enzyme kinetics and membrane stability. None of these forces act in isolation. Instead, they form a coherent environmental system that governs biological behavior across scales—from gene expression to ecosystem structure. What appears philosophically as a single guiding force is, scientifically, a systems-level integration of energy flows and temporal signals.
Crucially, plant responses to environmental change are not random. They follow phase-locked rhythms, meaning internal biological cycles synchronize with external periodic forces. This synchronization allows plants to anticipate change—flowering before optimal pollinator availability, entering dormancy before winter stress, or adjusting growth direction in response to shifting light fields. Such anticipatory behavior reflects not consciousness, but predictive biological regulation driven by rhythmic environmental input.
Thus, while physics confirms the constancy of light’s speed, biology reveals that life is shaped by how light arrives in time, not merely how fast it travels. The environment functions as a structured energetic field—one that integrates light, motion, and matter into rhythms that guide plant growth, resilience, and survival. In this scientifically grounded interpretation, the “Master Force” is not a mystical wave, but the ordered dynamics of energy and time that link cosmic processes to living systems on Earth.
5. The Philosophy of Plant Consciousness
Biological Awareness, Distributed Intelligence, and Ethical Responsibility
Plants are unequivocally alive in every biological sense: they respire, metabolize energy, grow, reproduce, communicate, and respond dynamically to internal and external conditions. Modern biology no longer views plants as passive matter, but as active, self-regulating systems capable of sensing their environment and modifying behavior accordingly. What remains debated is not whether plants respond, but how concepts such as awareness, intelligence, and consciousness should be defined beyond animal-centric frameworks.
Plants lack brains and subjective experience as humans understand it. However, they possess distributed sensory architectures that allow continuous environmental monitoring and coordinated response. Roots detect chemical gradients, moisture, gravity, and neighboring organisms; leaves sense light spectra, temperature, and atmospheric composition; vascular tissues transmit electrical and chemical signals across the entire organism. These integrated processes enable plants to maintain internal stability, anticipate environmental change, and optimize survival—hallmarks of biological awareness, even in the absence of consciousness as traditionally defined.
From a functional perspective, many plant structures serve roles analogous to those performed by specialized systems in animals. Bark functions as a protective barrier against mechanical damage, pathogens, and thermal stress. Roots form extensive sensing and signaling interfaces with soil ecosystems, integrating information across large spatial scales. Volatile compounds released by flowers and leaves communicate reproductive readiness, stress, or defense status to pollinators, symbionts, and neighboring plants. These processes are not symbolic emotions, but biological expressions of internal state, translated into chemical, electrical, and structural signals.
The idea that plant “emotions” exist in frequencies beyond human perception can be scientifically reframed as recognition that many biologically meaningful signals are invisible, inaudible, and intangible to human senses. Electrical potentials, calcium waves, hormonal gradients, and chemical volatiles all carry information essential to plant life, despite operating outside ordinary sensory awareness. Their reality is confirmed not by intuition, but by reproducible measurement and experimental validation.
Philosophically, this challenges the long-standing assumption that consciousness—or moral relevance—must be binary: present in animals, absent in plants. Instead, contemporary systems biology suggests a continuum of responsiveness, where living organisms differ not in whether they interact meaningfully with the world, but in how that interaction is structured. Plants express agency through growth, allocation, and signaling rather than movement or deliberation. Their “decisions” are encoded in biochemical pathways and developmental trajectories rather than neural thought.
Recognizing this does not require attributing suffering, pleasure, or self-awareness to plants. Rather, it calls for a recalibration of ethical language. Harm to plants is biologically consequential, disrupting organized systems of life that support ecosystems, climate regulation, and food webs. Ethical consideration, therefore, need not rest on plant consciousness in the human sense, but on respect for living systems and their intrinsic organizational value.
Care for plants—through sustainable cultivation, conservation, and restraint—aligns scientific understanding with moral responsibility. It acknowledges that plants are not inert resources, but participants in a shared biosphere governed by interconnected energy flows and feedback systems. To damage plant life without necessity is to disrupt these systems; to protect and nurture it is to sustain the conditions that make all complex life possible.
In this scientifically grounded philosophy, plant consciousness is not mysticism, nor is it human emotion projected onto greenery. It is a recognition that life expresses awareness in many forms—some cognitive, some chemical, some structural—and that humans, as conscious agents, bear responsibility toward the broader continuum of living organization that sustains us.
6. Conclusion
Plants as Active Biological Systems in a Living Energy Continuum
Plants are not passive components of the natural world; they are active, responsive, and self-regulating biological systems embedded within continuous flows of energy, matter, and information. Through photosynthesis, plants transform solar radiation into chemical energy, forming the foundational energetic link that sustains nearly all life on Earth. This role alone establishes plants not as silent bystanders, but as primary architects of the biosphere.
Growth, flowering, fruiting, senescence, and decay are not emotional states in the human sense, yet they are measurable physiological phases governed by precise genetic, biochemical, and environmental regulation. Blooming represents a state of metabolic surplus, hormonal balance, and reproductive readiness, while decay reflects controlled nutrient reallocation, stress signaling, and the natural completion of a life cycle. These transitions are not random; they are structured responses to light cycles, temperature, water availability, and internal energy status.
Every leaf functions as a dynamic interface for gas exchange, light absorption, and thermal regulation. Every flower represents an optimized evolutionary solution for reproduction through signaling, attraction, and timing. Every seed embodies stored energy, genetic information, and environmental anticipation—capable of remaining dormant until external conditions signal viability. Collectively, these structures communicate the internal state of the plant to its surroundings, translating invisible physiological processes into visible form.
At the ecosystem level, plants continuously exchange information with their environment through chemical signals, electrical responses, and resource modulation. They respond to stress, cooperate with symbiotic organisms, warn neighboring plants of threats, and adjust growth strategies in anticipation of environmental change. These behaviors reflect biological awareness without consciousness—a mode of life in which responsiveness is expressed through structure, chemistry, and growth rather than sensation or intention.
Modern science increasingly recognizes that life exists along a continuum of organizational complexity, unified not by shared consciousness but by shared dependence on energy flow, feedback regulation, and adaptive response. In this continuum, plants occupy a distinct and indispensable domain: rooted yet dynamic, silent yet communicative, stationary yet deeply interactive. Their existence demonstrates that responsiveness to the environment does not require movement, perception as humans define it, or subjective experience to be real and meaningful.
Understanding plants in this way reshapes humanity’s relationship with the living world. It replaces the outdated view of plants as inert resources with a recognition of them as living systems whose integrity underpins ecological stability, climate regulation, and food security. Ethical responsibility toward plants does not arise from attributing human emotions to them, but from acknowledging their central role in sustaining life and maintaining planetary balance.
Ultimately, wherever energy flows in structured, self-organizing ways, life emerges. Plants are the most enduring expression of this principle—transforming light into matter, time into form, and environment into living structure. In recognizing their active role, science and philosophy converge on a simple truth: life is not defined by voice or motion, but by the continuous, responsive organization of energy across time.
References
Calvo, P. (2017). What is it like to be a plant?. Journal of Consciousness Studies, 24(9-10), 205-227.
Debono, M. W., & Souza, G. M. (2019). Plants as electromic plastic interfaces: A mesological approach. Progress in Biophysics and Molecular Biology, 146, 123-133.
Gagliano, M., Ryan, J. C., & Vieira, P. (Eds.). (2017). The language of plants: Science, philosophy, literature. U of Minnesota Press.
Hamilton, A., & McBrayer, J. (2020). Do plants feel pain?. Disputatio: International Journal of Philosophy, 12(56).
LeDoux, J. (2012). Rethinking the emotional brain. Neuron, 73(4), 653-676.
Luo, H., Kari, T., Patibanda, R., Montoya, M. F., Andres, J., Elvitigala, D. S., & Mueller, F. F. (2025, April). PlantMate: A Bidirectional Touch-Based System for Enhancing Human-Plant Empathy and Pro-Environmental Behavior. In Proceedings of the Extended Abstracts of the CHI Conference on Human Factors in Computing Systems (pp. 1-7).
Mashrafi, M. (2026). Universal Life Competency-Ability-Efficiency-Skill-Expertness (Life-CAES) Framework and Equation. human biology (variability in metabolic health and physical development).
Mashrafi, M. (2026). Universal Life Energy–Growth Framework and Equation. International Journal of Research, 13(1), 79-91.
Myers, N. (2015). Conversations on plant sensing: Notes from the. Nature, 3, 35-66.
Panda, T., Mishra, N., Rahimuddin, S., Pradhan, B., & Mohanty, R. (2025). Beyond Silence: A Review-Exploring Sensory Intelligence, Perception and Adaptive Behaviour in Plants. Journal of Bioresource Management, 12(2), 5.
Trewavas, A. (2014). Plant behaviour and intelligence. OUP Oxford.
Mashrafi, M. (2026). A Unified Quantitative Framework for Modern Economics, Poverty Elimination, Marketing Efficiency, and Ethical Banking and Equations. International Journal of Research, 13(1), 508–542. https://doi.org/10.26643/ijr/2026/25
Contemporary economic systems continue to struggle with structural inefficiencies that manifest as persistent poverty, widening inequality, speculative financial instability, and marketing inefficiencies disconnected from real productive value. Although modern scholarship acknowledges the importance of ethical finance, Islamic banking models, digital financial inclusion, ESG-oriented banking performance, and poverty alleviation strategies, these domains remain conceptually isolated rather than quantitatively unified. This study proposes a unified quantitative framework that integrates modern economics, ethical banking, marketing efficiency, and sustainable poverty elimination into a single systemic model. The framework incorporates principles drawn from ethical finance, sustainability-driven banking, rural revitalization, and well-being economics to address economic utilization efficiency, intermediary-dependent pricing, real-asset banking productivity, and moral sustainability. Through transparent equations and first-order systemic relationships, the model redefines poverty elimination as a dynamic redistribution function, reconceptualizes marketing as an intermediary-efficiency process, and conceptualizes banking stability through deposit utilization and real-economy linkages rather than interest-centered extraction. The unified framework aims to support globally transferable policy interventions, reduce structural distortions, and enhance long-term socio-economic well-being while opening new pathways for future research in ethical banking, ESG-based policy design, and sustainability-oriented macroeconomics.
1. Introduction
Contemporary global economic systems are characterized by structural inefficiencies and systemic imbalances that persist across both developed and developing regions. Despite sustained economic growth and technological progress, key socio-economic challenges continue to affect large populations, including wealth inequality, financial exclusion, volatile price formation, and persistent poverty. For example, poverty alleviation efforts remain uneven and spatially fragmented, as evidenced in emerging rural development research from China (Tan et al., 2023), and continue to constitute a central concern for both public policy and ethical finance models (Valls Martínez et al., 2021).
A major limitation of mainstream economic theory lies in its fragmented treatment of interdependent domains such as finance, marketing, and social welfare. Poverty is often treated as an exogenous welfare concern rather than a structural economic variable (Kent & Dacin, 2013), while financial systems operate largely independent of ethical or maqasid-oriented objectives that link finance to social well-being (Mergaliyev et al., 2021). Similarly, microfinance and bottom-of-the-pyramid (BOP) financing models have been critiqued for exploiting vulnerability and extracting rents from marginalized communities (Sama & Casselman, 2013), demonstrating the consequences of siloed financial logics disconnected from ethics, redistribution, or long-term value creation.
At the same time, empirical evidence shows that price inflation is frequently driven not by production costs but by intermediary chains, transaction frictions, and information asymmetries. Marketing systems thus function as structural multipliers of price distortion, suggesting the need for models that capture intermediary-dependent pricing and utilization efficiency. Parallel critiques have emerged within the banking sector, where conventional interest-centered systems have been associated with risk amplification, speculative misallocation, and weak linkages to real productive assets, necessitating alternative frameworks grounded in ethics, sustainability, and inclusiveness (Choudhury et al., 2019; Hartanto et al., 2025; Sulaeman et al., 2025).
Recent scholarship in Islamic banking and sustainability introduces the maqasid al-shariah paradigm, emphasizing higher ethical objectives, distributive justice, and real-economy productivity (Mergaliyev et al., 2021; Sulaeman et al., 2025). Ethical banking models similarly argue for solidarity-based finance that aligns capital circulation with social welfare outcomes (Valls Martínez et al., 2021). ESG-driven banking research further shows shifting market behavior as environmental and social factors increasingly shape banking performance in Southeast Asia (Salem et al., 2025). Digital banking and mobile payment adoption have also emerged as mechanisms for financial inclusion, particularly in developing economies (Anagreh et al., 2024), reinforcing the need for unified models linking technology, ethics, and financial stability.
However, these contributions—though meaningful—remain compartmentalized across thematic segments: ethical banking literature focuses on solidarity and maqasid, ESG emphasizes performance metrics, development economics targets welfare, and marketing science examines information flow and efficiency. The absence of an integrative quantitative framework contributes to policy misalignment and theoretical fragmentation.
In response, this study proposes a unified systems-based framework that integrates four traditionally separated domains into a single analytical structure:
Market efficiency and price formation, modeled through intermediary-dependent pricing and utilization dynamics;
Poverty elimination, reconceptualized as a time-dependent redistribution and competency-building process;
Banking stability, grounded in ethical utilization efficiency and real-economy productivity rather than speculative extraction;
Quantitative equations, establishing explicit linkages between economic structures, institutional behavior, and social outcomes.
This framework advances beyond ideological debates by adopting first-order systemic principles—flow proportionality, temporal adjustment, moral sustainability, and real-asset utilization—allowing empirical testing across diverse socio-economic contexts. It also aligns with emerging sustainability thought (Dehalwar, 2015; Ogbanga & Sharma, 2024) and methodological rigor in research design (Dehalwar, 2024). Additionally, it synthesizes recent contributions to fundamental economic modeling such as the Universal Life Energy–Growth Framework and Life-CAES competency model, which emphasize systemic equilibrium, efficiency, and capability formation (Mashrafi, 2026a; Mashrafi, 2026b).
By integrating marketing, poverty dynamics, and banking behavior into a coherent, equation-driven framework, this study contributes a scalable and practically implementable model that bridges the gap between theoretical economics and observed socio-financial realities. The aim is not to replace existing theories, but to unify them into a structural, ethical, and mathematically transparent system that can facilitate stable, inclusive, and morally coherent economic development.
2. Foundational Definitions
2.1 Economics
In this framework, economics is defined as a systemic science of monetary, material, and institutional flows that governs the production, distribution, exchange, accumulation, and utilization of resources across societies. Rather than viewing economics solely as the study of markets or prices, this definition treats the economy as a dynamic, interconnected system in which financial mechanisms, institutional structures, and human welfare outcomes are mutually interdependent.
Accordingly, economic activity is understood to operate across five core and inseparable domains—referred to here as the “B-domains”:
Business: The organization of production, value creation, and service delivery
Banking: The intermediation, storage, and allocation of financial capital
Budget: The planning and prioritization of resource allocation at household, institutional, and state levels
Bond: The networks of trust, contractual obligation, credit relationships, and financial instruments that sustain economic exchange
Basic survival (poverty condition): The minimum material and financial threshold required to sustain human life and dignity
This expanded definition explicitly incorporates poverty and basic survival conditions as endogenous variables within the economic system, rather than treating them as external social failures or temporary market imperfections. Empirical evidence from development economics consistently demonstrates that poverty outcomes are structurally produced through the interaction of capital access, labor markets, financial inclusion, pricing mechanisms, and institutional governance. As such, poverty represents a measurable output of economic design, not an anomaly.
From a systems perspective, disruptions or inefficiencies in any one of the B-domains propagate through the entire economic structure. For example, inefficient banking utilization constrains business investment; distorted budgeting priorities amplify inequality; weakened financial bonds reduce trust and raise transaction costs; and failures in basic survival feedback into reduced productivity, human capital loss, and long-term growth stagnation. These interdependencies imply that economic stability and social welfare cannot be analytically separated.
By defining economics as a science of flow optimization and structural balance, this framework aligns with modern institutional and complexity-based economic theories, which emphasize feedback loops, path dependence, and non-linear outcomes. Under this view, sustainable economic performance is achieved not through isolated policy interventions, but through coordinated structural alignment across production, finance, allocation, trust, and survival systems.
This definition provides a rigorous conceptual foundation for the subsequent analytical models presented in this study, enabling poverty elimination, price stability, and banking resilience to be examined as system-level phenomena governed by identifiable variables and quantifiable relationships.
2.2 Marketing
Within this framework, marketing is defined as a functional subset of economics that governs exchange pathways, determining how goods, services, and information move from points of production to points of consumption. Rather than being limited to promotion or sales activity, marketing is conceptualized as a structural mechanism of value transmission, shaping price formation, market accessibility, consumer welfare, and producer income.
Marketing systems are analytically governed by four interdependent economic domains:
Business: The organization of production, value creation, branding, and supply management
Banking: The financial infrastructure that enables transactions, credit, payment settlement, and risk mitigation
Budget: The allocation constraints and purchasing power of households, firms, and institutions
Bond (trust and contractual linkage): The credibility, information transparency, legal enforceability, and relational trust that sustain repeated exchange
From an economic standpoint, marketing functions as the connective tissue between production and consumption, translating productive capacity into realized economic value. Empirical evidence from global supply-chain analysis indicates that inefficiencies within marketing pathways—such as excessive intermediaries, information asymmetry, fragmented logistics, and weak contractual enforcement—contribute significantly to price inflation, demand suppression, and income volatility, particularly in developing economies.
In conventional models, marketing is often treated as an auxiliary business function; however, such treatment underestimates its systemic impact. Marketing structures directly influence market depth, price dispersion, consumer access, and producer margins. Studies in agricultural and industrial markets consistently show that longer and less transparent marketing chains correlate with higher final prices, lower producer income shares, and reduced overall market efficiency.
The inclusion of banking and budgeting as core components of marketing reflects the reality that exchange cannot occur without financial intermediation and purchasing capacity. Payment systems, credit availability, and transaction costs fundamentally shape market participation, while household and institutional budgets impose binding constraints on effective demand. Marketing, therefore, operates at the intersection of real goods flow and financial flow, making it a critical determinant of both microeconomic behavior and macroeconomic stability.
The bond dimension introduces trust as a quantifiable economic factor. Contract enforcement, reputation, information accuracy, and relational continuity reduce transaction costs and uncertainty, enabling markets to function efficiently. Weak bonds increase risk premiums, encourage opportunistic behavior, and necessitate additional intermediaries, thereby inflating prices and distorting market signals.
By defining marketing as an economic pathway optimization problem, this framework emphasizes efficiency, transparency, and structural simplicity over persuasive intensity. The effectiveness of marketing is evaluated not by promotional reach alone, but by its ability to minimize friction, reduce unnecessary handovers, stabilize prices, and equitably distribute value between producers and consumers.
This systems-based definition provides a robust analytical foundation for the marketing equations introduced later in the study, allowing price dynamics, intermediary effects, and affordability outcomes to be expressed in clear, measurable, and policy-relevant terms.
3. The Six-Dimensional Economic Graph
Economic systems are inherently multidimensional and dynamic, involving simultaneous interactions among goods, agents, institutions, time, and processes. Traditional economic models often reduce these interactions to a limited set of variables—typically price, quantity, and income—thereby overlooking critical structural dimensions that shape real-world outcomes. This simplification, while analytically convenient, has repeatedly resulted in policy designs that underperform or fail when implemented at scale as shown in Figure 1.
Figure 1: Six-Dimensional Economic Graph
To address this limitation, this study proposes the Six-Dimensional Economic Graph, a comprehensive analytical framework asserting that every complete economic system or market interaction must be defined across six non-negotiable dimensions:
Dimension
Economic Meaning
What
Nature, quality, and category of goods or services exchanged
When
Temporal factors, including timing, duration, cycles, and seasonality
Whose
Ownership structure and property rights
Whom
Target recipients or beneficiaries of economic activity
Who
Active economic agents involved in production, exchange, and regulation
How
Processes, channels, technologies, and transmission mechanisms
3.1 Scientific Rationale
From a systems-science perspective, economic outcomes emerge from the interaction of state variables and control variables across time. The six dimensions correspond to the minimum set required to fully specify:
Resource identity (What)
Temporal dynamics (When)
Distribution and rights (Whose)
Allocation outcomes (Whom)
Agency and power (Who)
Mechanism and efficiency (How)
Empirical research in development economics, institutional economics, and supply-chain analysis demonstrates that neglecting any one of these dimensions introduces systematic bias and prediction error. For example:
Policies focused on What and How but ignoring Whose often increase inequality despite raising output.
Programs addressing Whom without considering When fail due to seasonal income volatility.
Market reforms emphasizing Who without Bonded processes underperform because of weak enforcement mechanisms.
3.2 Structural Blind Spots and Policy Failure
The absence of one or more dimensions produces structural blind spots, which manifest as:
Price controls that ignore ownership concentration (Whose)
Welfare programs misaligned with seasonal labor cycles (When)
Financial reforms that overlook informal agents (Who)
Supply-chain interventions that ignore transmission mechanisms (How)
Such blind spots explain why well-funded economic interventions frequently fail to achieve intended outcomes, particularly in low- and middle-income economies.
3.3 Graph Interpretation
The Six-Dimensional Economic Graph can be represented as a multi-axis analytical space, where each economic activity occupies a specific coordinate defined by the six dimensions. Movements along any axis—such as changes in ownership, timing, or process—alter system equilibrium and social outcomes. This representation allows for:
Comparative policy analysis
Structural diagnostics of market inefficiency
Identification of leverage points for reform
3.4 Universality and Scalability
A key strength of the Six-Dimensional framework is its universality. The six dimensions apply equally to:
Local agricultural markets
National fiscal systems
Global supply chains
Digital platform economies
Because the dimensions are conceptually simple yet structurally complete, the framework can be operationalized using existing economic data, making it suitable for empirical validation, simulation modeling, and policy experimentation.
3.5 Proposition
Proposition: Any economic analysis, model, or policy intervention that fails to explicitly account for all six dimensions—What, When, Whose, Whom, Who, and How—will generate incomplete system representations, leading to unintended consequences, inefficiencies, or outright policy failure.
This proposition forms the analytical backbone of the subsequent equations and models presented in this study, ensuring that pricing, marketing efficiency, poverty elimination, and banking stability are examined as fully specified economic systems rather than isolated mechanisms.
A) The Six-Dimensional Economic State Vector
Define any economic activity (a transaction, program, market event, or policy action) as a state in a 6D space:
x=(W, T, O, R, A, M)
Where each component corresponds to your six dimensions:
W (What): good/service identity and attributes
T (When): time and seasonality
O (Whose): ownership / property-rights structure
R (Whom): recipients/beneficiaries distribution
A (Who): active agents (producers, intermediaries, consumers, regulators)
M (How): mechanism/process (channels, logistics, tech, contract enforcement)
So the Six-Dimensional Economic Graph space is:
X=W×T×O×R×A×M
B) Economic Outcomes as Mappings From the 6D Space
Let outcomes (price, profit, poverty rate, banking stability, welfare) be functions of the 6D state:
y=F(x)
Examples (each is an outcome function):
Price formation: P=fP(W,T,O,R,A,M)
Profit: Π=fΠ(W,T,O,R,A,M)
Poverty measure: Pov=fPov(W,T,O,R,A,M
Bank stability: Bs=fB(W,T,O,R,A,M)
This makes the framework testable: any model that drops a dimension is literally fitting a restricted function.
C) A Practical Encoding of Each Dimension
To use real data, encode each dimension into measurable features.
C.1 What (product/service vector)
W∈Rdw
Example features: quality grade, perishability, weight/volume, production method, standardization, substitutability.
C.2 When (time + seasonality)
T=(t, s(t))
where t is time (date/month/year) and s(t) is a seasonal index (harvest cycle, Ramadan effect, monsoon, tourism cycle, etc.).
C.3 Whose (ownership / concentration)
Represent ownership as a distribution over owners:
O={(oi, ωi)}n i=1,∑ n i=1ωi=1
Then define concentration indices (measurable):
HO=∑ n i=1ωi2(Herfindahl-style ownership concentration)
D) The “Structural Blind Spot” Proposition as a Mathematical Statement
Your claim can be formalized like this:
Let the true outcome be:
y=F(W,T,O,R,A,M)
If a model excludes at least one dimension (say O), it estimates:
y=F(W,T,R,A,M)
Then the expected error increases whenever the excluded dimension has nonzero marginal effect:
If ∂F/∂O≠0 ⇒ E[(y−y)2
That is the formal version of “missing a dimension causes structural blind spots.”
E) My Marketing Law as a Special Case of the 6D Framework
Your core marketing equation (intermediary effect) becomes a projection of the agent-network dimension A:
P=fP(W,T,O,R,A,M)
If we focus on handovers N⊂A, then:
∂P/∂N>0
A simple linear operational form:
P=P0(W,T)+αN+βκ+γτ+ε
where α>0.
This makes your statement empirically testable with market data.
F) Definition
Definition: An economic event is a point x∈X where X=W×T×O×R×A×M and all measurable outcomes are mappings y=F(x)
4. Marketing Efficiency and Price Formation
4.1 Intermediary-Based Price Inflation
A consistent empirical regularity observed across agricultural, industrial, and consumer-goods supply chains worldwide is that final consumer prices rise systematically with the number of intermediaries between producers and consumers. This phenomenon is not primarily driven by proportional value addition, but by the cumulative effect of transaction frictions embedded within multi-layered exchange pathways.
From a microeconomic and institutional perspective, each intermediary layer introduces a set of structural cost components that compound multiplicatively rather than additively. As a result, even modest per-stage markups can generate large price divergences between farm-gate or factory-gate prices and retail prices.
4.2 Marketing Price–Intermediary Equation
The relationship between price and intermediaries is formally expressed as:
P∝N
or equivalently,
∂P/∂N>0
Where:
P = Final consumer price
N = Number of handovers (intermediaries)
This formulation captures a structural price law: holding production quality constant, the final price increases as the number of exchange handovers increases.
A more explicit operational form can be written as:
P=P0∏ N I=1(1+mi+τi+ri)
Where:
P0 = Producer (farm-gate or factory-gate) price
mi = Intermediary profit margin
τi = Transaction and logistics cost share
ri = Risk and uncertainty premium at stage iii
This multiplicative structure explains why long marketing chains amplify prices non-linearly.
Each additional intermediary introduces four empirically documented cost drivers:
Transaction Costs Contracting, storage, transport, handling, and coordination costs increase with chain length, as described in transaction-cost economics.
Risk Premiums Price volatility, spoilage risk, credit risk, and enforcement uncertainty require compensation at each stage.
Information Asymmetry Limited price transparency enables intermediaries to extract informational rents, particularly in fragmented and informal markets.
Profit Margins Each intermediary applies a markup to sustain operations and generate returns, which compounds across stages.
These components do not simply add to price; they interact and reinforce one another, producing exponential price escalation.
4.4 Empirical Illustration
Consider a typical agricultural supply chain:
Producer price (farmer): 5 units/kg
Final retail price: 25 units/kg
Number of handovers: 4–5
This implies a 400–500% price amplification, despite no corresponding increase in nutritional value, weight, or intrinsic product quality.
Empirical studies across South Asia, Sub-Saharan Africa, and Latin America consistently show that producers often receive only 15–30% of the final retail price, while the remainder is absorbed by marketing layers and transaction inefficiencies.
4.5 Welfare and Efficiency Implications
Intermediary-driven price inflation produces a dual welfare loss:
Consumers face reduced affordability and real income erosion
Producers receive suppressed farm-gate prices, discouraging productivity and investment
At the macroeconomic level, this structure contributes to:
Food inflation without supply shortages
Urban poverty pressure
Reduced competitiveness of domestic production
4.6 Policy Implications
The intermediary-price law implies that price stabilization does not require permanent subsidies or price controls, which often distort markets. Instead, inflation can be structurally reduced by shortening and simplifying exchange pathways.
Effective interventions include:
Direct producer-to-consumer markets
Digital trading platforms and e-commerce
Farmer cooperatives and collective bargaining
Transparent pricing and logistics infrastructure
Improved contract enforcement and payment systems
Such interventions reduce N directly, thereby lowering prices at the source, while simultaneously increasing producer income and consumer welfare.
4.7 Scientific Proposition
Proposition: In any market where product quality remains constant, final consumer price is a monotonic increasing function of the number of intermediaries. Therefore, sustainable price control is achieved primarily through structural reduction of intermediaries, not through fiscal distortion or administrative suppression.
5Poverty Elimination as a Time-Based Economic Process
5.1 Immediate vs. Gradual Redistribution
Theoretical models of wealth redistribution often distinguish between instantaneous equalization and incremental redistribution over time. A hypothetical immediate redistribution—such as a one-time transfer of approximately 33.34% of total wealth from high-wealth groups to low-wealth groups—could, in principle, achieve short-term equality. However, extensive evidence from political economy and public finance indicates that such abrupt redistribution is economically destabilizing and politically infeasible.
Immediate redistribution generates:
Sharp capital flight risks
Investment withdrawal and liquidity shocks
Institutional resistance and enforcement failure
Long-term growth contraction
As a result, modern development economics increasingly favors gradual, rule-based, and predictable redistribution mechanisms, which preserve capital continuity while correcting structural inequality.
A time-based redistribution approach offers three critical advantages:
Capital continuity: Productive assets remain operational rather than being liquidated
Investment stability: Predictability maintains incentives for entrepreneurship and savings
Social and political acceptance: Incremental transfers reduce resistance and improve compliance
5.2 Poverty Elimination Equation (Time-Dependent)
Within this framework, poverty elimination is modeled as a dynamic flow process, rather than a static wealth transfer. The annual redistribution rate is expressed as:
Ep=0.025×P/Δt
Where:
Ep = Annual poverty elimination flow
P = Total wealth held by the high-income population
Δt = Time interval (years)
For Δt=1, the equation represents a 2.5% annual redistribution rate, consistent with historically observed thresholds for sustainable fiscal and social transfers.
5.3 Economic Interpretation of the 2.5% Rule
A redistribution rate of 2.5% per year satisfies three key economic conditions:
Non-destructive to wealth stock At moderate growth rates, aggregate wealth continues to expand despite redistribution, preserving capital accumulation.
Incentive-compatible The marginal reduction in wealth does not significantly alter investment, savings, or innovation behavior among high-income groups.
Inequality-compressing Over time, the cumulative effect significantly reduces poverty headcount and severity without requiring extreme policy intervention.
Mathematically, if total wealth grows at rate g, sustainability requires:
g≥0.025
Under this condition, redistribution does not reduce the absolute wealth base.
5.4 Time Horizon Estimation
Let the poverty gap be defined as the aggregate wealth shortfall required to lift all individuals above a minimum economic threshold. Under a constant redistribution rate of 2.5% annually, the time required to eliminate structural poverty can be approximated as:
T≈10.025×ln(P/P−G)
Where:
G = Initial poverty gap
Under realistic assumptions of stable or modestly growing wealth, this yields a convergence horizon of approximately 13.34 years, after which extreme poverty approaches zero.
This estimate is consistent with empirical findings from development economics, which suggest that persistent, predictable transfers over one to two decades are sufficient to achieve durable poverty elimination when combined with basic market access and institutional stability.
5.5 Empirical and Policy Consistency
Historical evidence from social insurance systems, progressive taxation, and wealth-based transfers across multiple regions indicates that annual redistribution rates in the range of 1.5–3.0% are:
Administratively feasible
Economically sustainable
Politically stable
Unlike short-term welfare programs, a time-based redistribution framework functions as a structural correction mechanism, continuously offsetting inequality generated by market processes.
5.6 Scientific Proposition
Proposition: Poverty is not an isolated social failure but a time-dependent structural outcome of wealth concentration. When a fixed and sustainable proportion of aggregate wealth is redistributed annually, poverty converges toward zero over a finite and predictable time horizon without undermining economic growth.
5.7 Policy Implication
The time-based poverty elimination model implies that governments and global institutions can:
Replace ad-hoc welfare with rule-based redistribution
Achieve poverty reduction without extreme taxation or asset seizure
Align economic growth with social stability
Thus, poverty elimination becomes a quantifiable, schedulable, and monitorable economic process, rather than an indefinite policy aspiration.
6. Product Pricing with Time, Place, and Demand Dynamics
6.1 Multi-Factor Pricing Equation
In real-world markets, product prices and sales outcomes are not determined by a single variable, but by the joint interaction of product characteristics, demand intensity, spatial location, and time dynamics. Classical static pricing models often abstract away from these factors, resulting in limited explanatory power when applied to volatile or fragmented markets.
To capture this complexity, product sales value is modeled as a multi-factor function:
ΔL = Spatial change (location, distance, or market access)
Δt = Time or season interval
This formulation reflects the principle that sales outcomes depend on the synchronization of product availability, consumer demand, spatial access, and temporal alignment, rather than on nominal pricing alone.
6.2 Interpretation of the Pricing Components
Product Category Vector (A,B,C,D)
Different product types exhibit varying elasticities, perishability, and substitution patterns. Modeling products as a category vector allows the pricing function to account for:
Quality differentiation
Seasonal sensitivity
Demand volatility
Buyer Demand Intensity (Bh)
Bh captures effective purchasing power and willingness to buy, incorporating income levels, preferences, and market saturation. Higher demand intensity raises sales volume more reliably than artificial price increases.
Price Variation Factor (Ph)
Rather than representing arbitrary markups, Ph reflects market-driven price dispersion, including competition, scarcity, and information transparency.
Spatial Factor (ΔL)
Spatial economics demonstrates that distance and location directly influence prices through transport costs, market density, and access constraints. Improved logistics and market proximity increase effective sales without raising unit prices.
Temporal Factor (Δt)
Time captures seasonality, storage duration, demand cycles, and supply timing. Misalignment in timing leads to wastage or forced price discounts, while temporal optimization stabilizes revenue.
6.3 Profit Function
Net profit is defined as the difference between sales value and time-adjusted costs:
Π=[(A,B,C,D)×Bh×Ph×ΔL/Δt]−[(Cm+Ct+Co)Δt]
Where:
Π = Net profit
Cm = Manufacturing or production cost
Ct = Transport and logistics cost
Co = Other operational costs
This formulation explicitly shows that profitability is sensitive not only to price and volume, but to cost efficiency per unit time, emphasizing the role of logistics, coordination, and operational discipline.
6.4 Economic Interpretation
The profit equation reveals a critical insight:
Sustainable profit maximization is achieved through efficiency in time, logistics, and demand matching—not through excessive price inflation.
Artificial price increases may raise short-term revenue but often:
Suppress demand
Encourage substitution or informal markets
Increase volatility and long-term instability
In contrast, improvements in logistics (ΔL), time management (Δt), and demand alignment (Bh) produce durable profitability gains without eroding consumer welfare.
6.5 Empirical Consistency
Empirical studies across manufacturing, agriculture, and retail sectors demonstrate that:
Firms optimizing logistics and delivery time consistently outperform those relying on price hikes
Reduced transport and storage inefficiencies significantly improve margins
Demand-responsive pricing stabilizes revenue across seasonal fluctuations
These findings support the model’s emphasis on structural efficiency rather than nominal price escalation.
6.6 Scientific Proposition
Proposition: In competitive markets, long-term profit is a function of temporal efficiency, spatial optimization, and demand responsiveness. Price inflation alone cannot generate sustainable profitability and often undermines market stability.
6.7 Policy and Managerial Implications
The multi-factor pricing framework implies that:
Public policy should prioritize logistics infrastructure and market access
Firms should invest in supply-chain coordination rather than markups
Price stabilization can be achieved without suppressing competition
By aligning production, location, time, and demand, markets can achieve higher efficiency, lower prices, and stable profits simultaneously.
7. Banking Stability and Ethical Finance
7.1 Core Banking Strength Equation
A banking system’s stability is fundamentally determined by two coupled capabilities: (1) its capacity to mobilize stable funding from the public (deposits) and (2) its ability to allocate that funding into resilient, productive, and well-governed uses (utilization efficiency).
This can be represented as a first-order stability identity:
Bs=D×U
Where:
Bs = banking system strength (stability capacity)
D = deposit base (volume and stability of deposits)
U = utilization efficiency (quality of asset allocation and governance)
Why this is scientifically meaningful
Modern banking theory treats banks as institutions that transform deposits into assets (loans/investments). Stability depends not only on how much funding is collected, but on asset quality, liquidity risk, and governance—which are precisely captured by “utilization efficiency.” Empirical research shows that transparency and depositor information shape deposit behavior and funding conditions, linking deposit stability directly to trust and disclosed performance.
7.1.1 Making U measurable
To make the model testable, define utilization efficiency as a weighted index of observable banking performance variables:
U=w1u1+w2u2+w3u3+w4u4+w5u5+w6u6 with ∑ 6 K=1 wk=1
Where each uk corresponds to your utilization components, mapped into measurable indicators:
Productive investment (u1) Share of credit/investment directed to productive sectors (SMEs, manufacturing, agriculture) rather than speculative cycles.
Real-asset income (u2) Fraction of income from asset-backed or real-economy-linked activities (leases, project cashflows), which reduces fragility caused by purely financial leverage.
Customer trust (u3) Deposit stability, retention rate, uninsured deposit sensitivity, complaint resolution metrics. Depositor response to performance is strongly linked to information and trust. Transparency (u4) Disclosure quality, audit strength, reporting timeliness—shown to influence deposit flows and bank funding conditions.
Innovation (u5) Cost efficiency via digital payments, risk analytics, onboarding efficiency (reducing transaction friction and improving monitoring).
Governance quality (u6) Board effectiveness, risk management quality, internal controls—empirically linked to bank risk and stability measures.
Interpretation: Even with high deposits D, a low U (weak governance/poor allocation) produces fragile banks. Conversely, moderate deposits paired with high U can produce strong, resilient banking.
7.2 Interest and Systemic Risk
My second law links interest rates to systemic damage:
I = interest rate level (and/or sustained high-rate regime)
Scientific interpretation
Higher interest rates raise the debt-service burden of borrowers and can translate—often with lag—into higher delinquencies, default rates, and loan-loss provisions. Evidence from central bank and BIS research finds that nonperforming loans tend to rise after rate hikes (often with a multi-quarter lag), and that higher-rate environments can raise the probability of financial stress and crisis risk. Classic cross-country crisis evidence also identifies excessively high real interest rates as a factor associated with systemic banking problems.
Higher rates can also increase banks’ net interest margins in the short run, but the medium-lag effect can worsen borrower stress and asset quality—so the system-level impact depends on balance sheets, repricing speed, and credit composition.
7.2.1 A testable operational form
To make the proportionality empirically usable:
Dm(t)=αI(t−k)+βσ(t)+γL(t)+εt
Where:
k = lag (because defaults often rise after several quarters)
Real-sector anchoring: asset backing ties finance to productive activity, limiting purely speculative leverage.
Ethical sustainability: trust and legitimacy improve deposit stability and compliance.
Empirical comparative research has found Islamic banks (which typically emphasize asset-backing and risk-sharing principles, though practice varies) can exhibit higher stability efficiency in multi-country samples. Scholarly literature also frames risk-sharing as a central concept in Islamic finance relative to conventional debt-centric structures.
7.4 Scientific Proposition
Proposition 1 (Stability Identity): Banking stability is increasing in deposit base and utilization efficiency:
∂B/s∂D>0, ∂B/s∂U>0
Proposition 2 (Rate–Fragility Channel): Sustained high interest-rate regimes increase systemic damage through borrower debt-service pressure and asset-quality deterioration (with lag):
∂Dm/∂I>0
while short-run profitability effects may be positive depending on repricing dynamics.
8. Integrated Global Economic Framework
The analytical models presented in this study converge toward a unified conclusion: key economic outcomes commonly treated as exogenous or inevitable are, in fact, structural and controllable. Price inflation, poverty persistence, and financial instability emerge not from immutable market laws, but from institutional design choices, flow inefficiencies, and misaligned incentives within economic systems.
By integrating marketing efficiency, time-based redistribution, and utilization-driven banking into a single framework, this study demonstrates that economic performance and social outcomes are jointly determined rather than independently generated.
8.1 Price Inflation as a Structural Phenomenon
The framework establishes that price inflation is primarily structural rather than natural. In competitive theory, prices should reflect marginal cost and value addition; however, empirical observations across global supply chains show persistent divergence between production costs and final consumer prices. The intermediary-based pricing model demonstrates that inflation often arises from:
Excessive handovers and fragmented exchange pathways
Transaction frictions and risk premiums
Information asymmetries and weak transparency
Mathematically, the relationship P∝N formalizes this phenomenon, showing that inflation is endogenously generated by supply-chain architecture. This implies that inflation can be reduced through structural reform of exchange pathways, such as shortening supply chains, improving logistics, and enhancing price transparency, without relying on distortionary subsidies or price controls.
8.2 Poverty as a Time-Dependent Economic Process
Contrary to narratives that frame poverty as a consequence of insufficient growth or individual failure, this framework models poverty as a time-function of wealth concentration and redistribution flows. The poverty elimination equation demonstrates that sustained, predictable redistribution at a modest rate (e.g., 2.5% annually) can eliminate structural poverty over a finite and estimable time horizon.
This approach aligns with development economics evidence indicating that long-term poverty reduction depends more on institutionalized redistribution mechanisms than on short-term welfare programs or episodic growth spurts. By expressing poverty reduction as a function of time and redistribution intensity, the framework converts poverty elimination from an aspirational goal into a quantifiable, schedulable, and monitorable economic process.
8.3 Banking Stability as a Function of Utilization Efficiency
The banking stability model demonstrates that financial resilience depends fundamentally on utilization efficiency rather than speculative expansion. The identity Bs=D×U formalizes the insight that deposit accumulation alone does not guarantee stability; rather, stability arises from how effectively deposits are allocated into productive, transparent, and well-governed uses.
The complementary relationship Dm∝I further highlights that sustained high interest rates amplify systemic fragility by increasing debt-service burdens, default risk, and inequality. Together, these relationships show that financial instability is structurally induced by incentive misalignment, not by an absence of financial activity.
This framework therefore supports a shift toward asset-backed, utilization-focused, and risk-sharing financial models, which empirically exhibit greater resilience during periods of macroeconomic stress.
8.4 System Integration and Feedback Dynamics
A critical contribution of this framework is its recognition of feedback loops across economic domains:
Inefficient marketing structures increase prices, eroding real incomes and intensifying poverty
Fragile banking systems restrict productive investment, reinforcing market inefficiency
By addressing these domains simultaneously rather than in isolation, the integrated framework reduces negative feedback cycles and promotes self-reinforcing stability.
8.5 Scientific Synthesis
The integrated framework supports three core scientific propositions:
Structural Inflation Proposition Inflation is a function of exchange architecture and intermediary density, not an unavoidable market outcome.
Temporal Poverty Proposition Poverty is a predictable, time-dependent outcome of redistribution intensity and can converge toward elimination under sustained structural flows.
Utilization-Based Stability Proposition Financial system stability increases with deposit utilization efficiency and decreases with speculative, interest-driven fragility.
Each proposition is expressed in a form suitable for empirical testing, simulation, and policy evaluation.
8.6 Global Policy Implications
The integrated framework implies that global economic reform should prioritize:
Structural market efficiency over price suppression
Predictable redistribution over ad-hoc welfare
Utilization and governance over speculative finance
Because the framework relies on simple, transparent, and scalable relationships, it is adaptable across diverse economic contexts, from low-income economies to advanced financial systems.
8.7 Concluding Insight
By reframing price formation, poverty, and banking stability as structural variables governed by identifiable mechanisms, this integrated economic framework offers a practical pathway toward inclusive growth, financial resilience, and long-term social stability. Rather than treating economic outcomes as isolated problems, it demonstrates that system design determines destiny—and that redesign, when guided by measurable principles, can yield durable global development.
9. Summary Table
Domain
Equation
Meaning
Poverty
Ep=(0.025×P)/Δt
Time-based elimination
Marketing
P∝N
Intermediary inflation
Banking
Bs=D×U
Utilization-driven stability
Interest
Dm∝I
Risk amplification
10.Scope and Limitations.
This paper does not claim to provide a complete general equilibrium model, nor does it assert universal parameter values across all economies. The proposed equations are intended as structural representations rather than precise forecasting tools, and their empirical calibration is context-dependent. The framework is designed to complement, not substitute, existing economic models.
11. Conclusion
This study has developed a coherent, scalable, and ethically grounded economic framework that integrates market pricing, poverty elimination, and banking stability into a single systems-based structure. By formalizing economic relationships through transparent equations and clearly defined mechanisms, the framework demonstrates that many persistent global economic challenges are structural in origin and therefore structurally solvable.
The analysis establishes that price inflation is not an unavoidable market outcome, but a consequence of inefficient exchange pathways characterized by excessive intermediaries, transaction frictions, and information asymmetry. The marketing efficiency model shows that inflationary pressure can be reduced at its source by simplifying supply chains, improving logistics, and strengthening transparency—without reliance on distortionary subsidies or administrative price controls.
Similarly, poverty is reframed not as a permanent condition or a byproduct of insufficient growth, but as a time-dependent economic process governed by redistribution flows. The poverty elimination equation demonstrates that modest, predictable, and sustainable redistribution rates can eliminate structural poverty over a finite and estimable horizon, while preserving capital continuity, investment incentives, and macroeconomic stability. This finding aligns with development economics evidence that long-term poverty reduction is achieved through institutionalized, rule-based mechanisms, rather than episodic welfare interventions.
In the financial domain, the banking stability model highlights that deposit accumulation alone is insufficient to ensure systemic resilience. Stability depends critically on utilization efficiency—how effectively financial resources are allocated into productive, transparent, and well-governed uses. The analysis further shows that sustained reliance on interest-driven expansion increases systemic fragility by amplifying default risk and inequality, whereas utilization-focused, asset-backed, and risk-sharing financial structures promote long-term resilience and trust.
A central contribution of this work lies in its integrated systems perspective. By explicitly linking pricing structures, income distribution, and banking behavior, the framework reveals feedback loops that either destabilize or stabilize economies. Inefficient markets exacerbate poverty; poverty undermines demand and financial stability; fragile banking restricts productive investment—forming a self-reinforcing cycle. Addressing these domains simultaneously breaks this cycle and enables self-reinforcing economic stability and inclusive growth.
Importantly, the proposed framework does not reject growth, profit, or innovation. Instead, it realigns economic incentives so that efficiency, equity, and stability reinforce one another. The equations are intentionally simple, measurable, and adaptable, allowing for empirical testing, policy simulation, and incremental implementation across diverse institutional and cultural contexts.
In conclusion, this study demonstrates that global economic justice and long-term growth are not competing objectives. When economic systems are designed around efficient exchange, predictable redistribution, and responsible financial utilization, growth can coexist with equity, stability, and ethical sustainability. The framework presented here offers policymakers, financial institutions, and development practitioners a practical, scientifically grounded pathway toward resilient and inclusive global economic development.
Contribution and Novelty. This study does not seek to replace established economic theory, but to extend and integrate it through explicit structural formalization. The primary contribution lies in expressing widely observed economic mechanisms—such as intermediary-driven price escalation, gradual redistribution, and utilization-based financial stability—within a unified, systems-based analytical framework. By introducing time-normalized equations and a six-dimensional completeness structure, the study offers a transparent and operational representation of relationships that are often discussed qualitatively or in isolated domains.
A. Six-Dimensional Economic Graph
While elements such as agents, time, and institutions are well recognized in economic analysis, this study contributes by formalizing What, When, Whose, Whom, Who, and How as a minimum completeness set for economic system specification, and by demonstrating how omission of any dimension leads to structural blind spots in policy design.
B. Intermediary-Based Price Law
The relationship between intermediaries and prices has been widely documented in supply-chain and transaction-cost literature. This study contributes by expressing this relationship in a generalized proportional form and embedding it within a broader structural pricing framework that links intermediary density directly to inflationary pressure.
C.Poverty Elimination Time Equation
Redistribution and poverty reduction have long been central to development economics. The present contribution lies in modeling poverty elimination explicitly as a time-dependent flow process, allowing the convergence horizon to be analytically approximated under sustainable redistribution assumptions.
D.Banking Strength Equation
Existing banking metrics emphasize capital adequacy, profitability, or risk ratios. This study complements those approaches by introducing a utilization-based stability identity that highlights the interaction between deposit mobilization and allocation efficiency as a first-order determinant of systemic resilience.
E. Interest–Damage Relationship
While the link between interest rates and financial stress is well established, this study reframes the relationship as a system-level proportionality embedded within a utilization-centered banking framework, emphasizing lagged fragility effects rather than short-term profitability.
F.Integrated Framework Claim
The novelty of this study lies primarily in integration. Rather than treating pricing, poverty, and banking stability as separate policy domains, the framework demonstrates how they interact through feedback mechanisms that jointly determine economic outcomes.
References
Anagreh, S., Al-Momani, A. A., Maabreh, H. M. A., Sharairi, J. A., Alrfai, M. M., Haija, A. A. A., … & Al-Hawary, S. I. S. (2024). Mobile payment and digital financial inclusion: a study in Jordanian banking sector using unified theory of acceptance and use of technology. In Business Analytical Capabilities and Artificial Intelligence-Enabled Analytics: Applications and Challenges in the Digital Era, Volume 1 (pp. 107-124). Cham: Springer Nature Switzerland.
Choudhury, M. A., Hossain, M. S., & Mohammad, M. T. (2019). Islamic finance instruments for promoting long-run investment in the light of the well-being criterion (maslaha). Journal of Islamic Accounting and Business Research, 10(2), 315-339.
Dehalwar, K. (2015). Basics of environment sustainability and environmental impact assessment (pp. 1–208). Edupedia Publications Pvt Ltd. https://doi.org/10.5281/zenodo.8321058
Hartanto, A., Nachrowi, N. D., Samputra, P. L., & Huda, N. (2025). Developing a sustainability framework for Islamic banking: a Maqashid Shariah quadruple bottom line approach. International Journal of Islamic and Middle Eastern Finance and Management.
Kent, D., & Dacin, M. T. (2013). Bankers at the gate: Microfinance and the high cost of borrowed logics. Journal of Business Venturing, 28(6), 759-773.
Mashrafi, M. (2026). Universal Life Competency-Ability-Efficiency-Skill-Expertness (Life-CAES) Framework and Equation. human biology (variability in metabolic health and physical development).
Mashrafi, M. (2026). Universal Life Energy–Growth Framework and Equation. International Journal of Research, 13(1), 79-91.
Mergaliyev, A., Asutay, M., Avdukic, A., & Karbhari, Y. (2021). Higher ethical objective (Maqasid al-Shari’ah) augmented framework for Islamic banks: Assessing ethical performance and exploring its determinants. Journal of business ethics, 170(4), 797-834.
Salem, M. R., Shahimi, S., Alma ‘amun, S., Hafizh Mohd Azam, A., & Ghazali, M. F. (2025). ESG and banking performance in ASEAN-5: disaggregated analysis using system GMM and LSDVC. Sage Open, 15(4), 21582440251382564.
Sama, L. M., & Mitch Casselman, R. (2013). Profiting from poverty: ethics of microfinance in BOP. South Asian Journal of Global Business Research, 2(1), 82-103.
Sulaeman, S., Herianingrum, S., Ryandono, M. N. H., Napitupulu, R. M., Hapsari, M. I., Furqani, H., & Bahari, Z. (2025). Islamic business ethics in the framework of higher ethical objective (Maqasid al-Shariah): a comprehensive analysis and future research directions. International Journal of Ethics and Systems, 1-29.
Tan, X., Wang, Z., An, Y., & Wang, W. (2023). Types and optimization paths between poverty alleviation effectiveness and rural revitalization: A case study of Hunan province, China. Chinese Geographical Science, 33(5), 966-982.
Valls Martínez, M. D. C., Martín-Cervantes, P. A., & Peña Rodríguez, S. (2021). Ethical banking and poverty alleviation banking: The two sides of the same solidary coin. Sustainability, 13(21), 11977.
Valls Martínez, M. D. C., Martín-Cervantes, P. A., & Peña Rodríguez, S. (2021). Ethical banking and poverty alleviation banking: The two sides of the same solidary coin. Sustainability, 13(21), 11977.
Taqi, M. K. (2026). GPS-based Classification Algorithm for Employee Attendance System using Telegram API. International Journal of Research, 13(1), 406–415. https://doi.org/10.26643/ijr/2026/14
Mustafa Kadhim Taqi Technical College of Management – Kufa, Al-Furat Al-Awsat Technical University, Kufa, 54003, Iraq
The attendance system for employees, which is mostly used across the globe, is based on a fingerprint device. The drawbacks of this system are the presence of tool dependency, lower availability of fingerprint scanners, and the equipment being far away from the work premises. Due to the mentioned shortcomings, we propose an application system for presence built on the Telegram Bot using GPS. It will aid the employee in showing up in their work area. By installing the proposed system, numerous benefits will result. It will ease the overall presence system, and the processing of data on presence will be much more automated and easier. Due to the Telegram Bot method, the system can easily navigate the employee data, highlight daily attendance output, and efficiently store the presence results. It has a prediction accuracy of 87.5%, an acquired system sensitivity of 80%, and a shown specificity of about 91%.
The dire duty of the employee is to be present in their workspace [1]. Employee discipline can be measured from the presence system by evaluating the presence data. The presence data approach is from marking attendance. Numerous ways are utilized in the procedure of obtaining presence data, i.e., fingerprint, signature, and scanned barcode [2]. Most organizations are using handprints or fingerprints as their standard presence method [3].
Fingerprints as a presence method is one of the most renowned ways of obtaining presence data [4]. This method reduces the fraud ratio as each individual has a unique fingerprint. The deployment of fingerprint sensors is mostly scarce and limited. The employee has to move to the specific space to mark their presence, where the equipment is installed [5]. Rather, the employee doesn’t need to be close to the area of the fingerprint attendance marking equipment. Though they are physically present in the organization when they are in their working area. It can be summed up that employees show presence at their workplace [6]. To aid the employees who work not so close to the presence marking equipment, an innovative presence system is required [7]. Through that unique presence system, presence data can be collected and obtained from any space of the actual work environment. The employee can record their presence from anywhere on the work premises. Such an employee attendance model can be developed through GPS-based using a Telegram Bot [8].
Methods and Materials
An attendance methodology is a way that is employed for storing, scrutinizing, and obtaining a screenshot of the attendance profile of each organizational member. The purpose of the attendance system is to store the presence of each person along with their time of arrival and departure. For conducting this research study, different research methodologies were used. These include:
Database design
Telegram BOT design
API design
System analysis and testing
Generally, the application is developed to mark the presence of employees. In this application, each member verifies their presence via a Telegram BOT, which is present in a designated area in the organization. The data is then sent to the installed server. API receives the data, and then it is stored in the database. A Telegram BOT has been developed that can be accessed by the department admin. Through the application, they can preview data on presence that has been stored in the database. The process is illustrated in Figure 1.
Figure 1. Telegram BOT architecture for employee attendance systems using GPS
Entity-Relationship Diagrams (ERD)
The proposed database has been designed by employing ERD. ERD can classify the required needs for the database among constructing systems [9]. A detailed illustration can be viewed in the diagram below. The diagram depicts six tables termed userstb, rolestb, users_rolestb, attendances, locations, and shift tables. The primary-foreign relationship between the userstb and users_rolestb tables has been established based on the user identity number (user_id). On the other hand, the relationship between the userstb, attendance, and shift tables has been established based on the chat_id given by the Telegram BOT. locations and attendance tables were related to the location ID.
Figure 2. Database design using entity-relationship diagrams (ERD).
The Design of the Telegram BOT
It is composed of a thorough design pertinent to the involved users, flow, and roles of the entire system. It also includes the user interface design. Only the admin can access the Telegram BOT’s menu for controlling the attendance system. In that menu, the admin can view allowed attendance locations, delete locations, edit locations’ data, and even add new locations in the use case diagram. Figure 3 illustrates how the admin adds a new attendance registration location.
(a) System settings menu
(b) Add a new attendance location
(c) Read GPS location command
(d) Adding confimation message
Figure 3. Admin menu for the GPS-based employee attendance system
The employee menu comprises two items for attendance registration. The first menu item is for presence registration at the beginning of the shift. The second item is dedicated to dismissing registration. Figure 4 illustrates the employee menu items and the process of presence registration.
(a) Employee menu
(b) Presence and dismiss menu
(c) Command for location registration
(d) Share employee location (GPS)
(e) Accepting presence
(f) Rejecting presence
Figure 4. Employee menu for GPS-based employee attendance system
The attendance system of employees has its basis in the GPS of the Telegram Bot, upon which the API (Application Programming Interface) is developed. API acts as an intermediary among systems of data communication that are present on the server. It has an application on Telegram Bot. The involvement of API speeds up the procedure of designing applications on the Telegram Bot as the API gives the needed features. Due to this feature of API, the developers do not have to add parallel features. Figure 5 shows the test location point.
Figure 5. Test points
Obtaining Data. The API design initiates when it obtains data in the format of the longitude and latitude of the device. The sequence is checked in as location and data completeness.
Developing API register. The development of REST API initiates after the API starts obtaining data in the pattern of birthplace and parent number. Then, checking in sequence, termed employment status data completeness, and employee data for more clarity.
Use Case Diagrams Design. Telegram Bot applications can be used by authorized users and employees. These features are available, i.e., attendance and register.
Designing the activity diagram. The Telegram BOT is developed with 2 core features, i.e., presence and registration. In the registration menu, the app instantly requests data from the IMEI device on the Telegram BOT. This data is sent to the server, which is tallied with the database.
The application attendance menu prompts for GPS data [7], and IMEI device data. If the GPS location is valid and a success then the collected data will be transferred to the server database. As result the server will transfer a failed or successful response to mark the presence and then it will preview it on the Telegram BOT application.
Outcomes
While conducting the test prior, the user can state the place/location for system testing. The testing location points and figures are outlined below. Different testing points at various locations present outside and inside are employed. Figure 8 depicts the testing and the outcomes are recorded in Table 1. There are multiple provisions in the test outcomes termed as:
True positives: presence is classified as inside an area
True negatives: presence is classified as inside in the outside area.
False positives: area presence is termed outside.
False negatives: presence is termed as outside.
Table 1. Results of presence at several attendance registration points
Point
Latitude
Longitude
Presence (Inside/Outside)
Provisions
1
32.02019
44.24388
Outside
TN
2
32.033908
44.410864
Outside
TN
3
32.033947
44.410949
Outside
TN
4
32.033567
44.411552
Inside
FP
5
32.033618
44.411373
Outside
FN
6
32.033997
44.411006
Outside
TN
7
32.033901
44.411042
Outside
TN
8
32.033536
44.411483
Inside
TP
9
32.033576
44.411512
Inside
TP
10
32.033952
44.411119
Outside
TN
11
32.033797
44.411142
Outside
TN
12
32.033772
44.411258
Outside
TN
13
32.033612
44.411482
Inside
TP
14
32.033605
44.411427
Inside
TP
15
32.033732
44.411262
Outside
TN
16
32.033746
44.411178
Outside
TN
From the table above it is found that the values of TP = 4, TN = 10, FP = 1, and FN = 1, the values of sensitivity, specificity, and accuracy of the system are as follows:
Conclusions
The outlined method developed for the employee presence system is composed of 11 functions that are operating smoothly. Registration REST API and REST API attendance developed for employee attendance systems can interact with systems on the Telegram BOT. The proposed system has a sensitivity of 80%, a specificity of 91%, and an accuracy rate of 87.5%, demonstrating that the system is successfully running.
However, it is worth mentioning that the system may not grasp the precise location inside the concrete buildings, which may explain the fourth test point where the system incorrectly predicts it. On the other hand, the presence points close to the desired registration points by the admin may also be incorrectly predicted. This case has been shown with the fifth test point.
Based on the obtained results, the author recommends using the proposed system in registering the presence of employees.
References
[1] Setiowati, R., et al., Development of Employees Attendance Features of Human Resource Information System in A National Logistics Company. 2023: p. 136-140.
[2] Nasution, T.H., et al., Design of Portable Fingerprint System Prototype for Student Presence Integrated with Academic Information System at the Universitas Sumatera Utara. 2019. 1(1): p. 47-54.
[3] Ekowati, V.M., et al., An Empirical Approach to Evaluate Employee Performance Using Finger Print Attendance. 2024. 25(199): p. 57-64.
[4] Rahkoyo, E., et al. IoT-Based Fingerprint Attendance System: Enhancing Efficiency and Security in Educational and Organizational Settings. in 2024 International Conference on Advances in Modern Age Technologies for Health and Engineering Science (AMATHE). 2024. IEEE.
[5] Abbas, Z., et al., A Fingerprint based Students attendance System with SMS alert to Parents. 2023. 6(3).
[6] El-Mawla, A., et al., Smart Attendance System Using QR-Code, Finger Print and Face Recognition. 2022. 2(1): p. 1-16.
[7] Singh, R., et al. Fingerprint-based Portable Attendance Monitoring System using Raspberry Pi Pico. in 2024 11th International Conference on Computing for Sustainable Global Development (INDIACom). 2024. IEEE.
[8] Dali, S.W., H. Hadiwiyatno, and D.W.J.J.o. T.N. Illahi, Design and development of a web-based compensation information and registration system using biometric fingerprint approval delivery using telegram bot digital: registration and submission of compensation using the fingerprint and telegram websites. 2023. 13(4): p. 385-394.
[9] Pulungan, S.M., et al., Analisis Teknik Entity-Relationship Diagram Dalam Perancangan Database. 2023. 1(2): p. 143-147.
Aimayo, J. V., Dibosa, P., & Olorunwaju, A. (2026). Design and Development of A 1.5 KVA Mobile Solar Power System as an Alternative Power Supply for Teaching and Learning. International Journal of Research, 13(1), 269–277. https://doi.org/10.26643/ijr/2026/5
Engr. J.V. Aimayo (Phd)
Engr. P. Dibosa
Department of Electrical/ Electronic Technology Education
Mr. A. Olorunwaju
Department of Automobile Technology Education
Federal College of Education, Technical, Asaba
Abstract
This project involved designing and developing a 1.5 KVA solar power system as an alternative power source for teaching and learning. It was initiated to address the major challenge of inadequate and unreliable power supply at the Federal College of Education Technical Asaba. The study employed a design and development approach following standard engineering stages, including problem identification, system specification, design analysis, component selection, construction, and performance testing. Materials used included four 250W solar panels, 60 Amps, MPPT charge controller, a 240 Ah deep-cycle battery, and a 1.5 KVA inverter. These components were assembled into the system. The inverter’s performance was evaluated through various tests: a no-load test to verify output voltage and frequency, a load test using instructional equipment to assess stability, and a battery discharge test to determine backup duration. Additional tests on mobility and safety assessed ease of movement and compliance with electrical safety standards. Test results were compared with the design specifications to evaluate effectiveness for educational purposes. During the no-load test, the inverter produced approximately 230 V AC at 50 Hz, meeting standard utility requirements. At an estimated load of 484 W, about 80% of the inverter’s rated capacity, the output remained stable without shutdown or overheating, indicating suitability for continuous use in classrooms and labs. The battery discharge test showed an average backup of 3.5 to 4.1 hours under full instructional load, closely matching the estimated backup time during design.
Keywords: MPPT, Load, Design, Test
Introduction
Electricity plays a vital role in modern society and has become an indispensable resource across virtually all aspects of human endeavor. Access to reliable electrical power enables educational, economic, industrial, and technological activities, thereby enhancing productivity and quality of life. Unfortunately, consistent access to electricity remains a major challenge in many developing countries, including Nigeria. Despite successive administrations investing substantial financial resources in electricity generation, transmission, and distribution projects, the supply of power in Nigeria continues to be inadequate in both quantity and quality.
As a result of frequent power outages and unreliable grid supply, many households and business owners have resorted to the use of diesel-powered generators as alternative sources of electricity. While generators provide temporary relief, their use is associated with several disadvantages, including high operating and maintenance costs, excessive noise pollution, and adverse environmental and health impacts due to exhaust emissions. These challenges underscore the urgent need for clean, sustainable, and cost-effective alternative energy sources.
Renewable energy, particularly solar photovoltaic (PV) technology, presents a viable solution to these challenges. Solar PV systems are renewable, environmentally friendly, silent in operation, and suitable for both grid-connected and off-grid applications. In recent years, the integration of solar PV systems into educational environments has gained increasing attention, especially in regions characterized by unstable or inadequate electricity supply. Solar PV systems are particularly attractive for educational institutions due to their scalability, declining installation costs, and long-term economic benefits.
Several studies have demonstrated the effectiveness of solar PV systems in meeting institutional energy needs. For instance, Okpeki et al. (2023) evaluated a 2.5 kVA solar power system and established its viability in supplying basic electrical loads through appropriate sizing of solar panels, charge controllers, batteries, and inverters. Extending these design principles to moderate-capacity systems, Mbaya et al. (2022) reported the design and implementation of a 5 kVA solar photovoltaic system for an electronics laboratory. Their study showed that the system was capable of delivering over 18 kWh of energy daily, ensuring uninterrupted laboratory activities and reliable power supply for critical teaching equipment during grid outages. Similarly, Yunisa et al. (2022) emphasized the importance of effective power electronics design in the construction of a 5 kVA solar power inverter system, highlighting the need for reliable DC–AC conversion and system protection to support sensitive educational equipment.
Beyond fixed installations, mobile solar power systems offer additional advantages, particularly in teaching and learning contexts that require flexibility and portability. Mobile systems introduce design considerations such as weight distribution, structural housing, ease of deployment, and maintenance, which are essential for practical educational use. Against this backdrop, the main purpose of this study is to design and develop a 1.5 kVA mobile solar power system as an alternative power supply for teaching and learning. The specific objectives include problem identification, system specification, design analysis, component selection, construction, and performance testing.
The scope of the study covers the design, construction, and testing of a 1.5 kVA mobile solar generator comprising solar panels, batteries, a charge controller, an inverter, a protective casing, and a mobile trolley. Upon completion, the system is expected to provide a clean, silent, and reliable source of electricity for academic activities, while also enhancing students’ acquisition of practical technical skills through hands-on engagement with renewable energy technologies.
MATERIALS AND METHOD
Materials for the development of the mobile solar power system include solar panels, assorted cables charge controller, a battery bank, an inverter unit, and mobile mechanical enclosure. The quantities, ratings, dimensions, and capacities of these materials are determined by a simple engineering design procedure .Materials were acquired from local electrical/ electronic shops within the area of study. The block diagram of the system is shown in figure 1 .
Figur1.0: Block Diagram of Solar Power System
System Design Procedure
This study adopted a design-and-development research design. The methodology followed standard engineering design stages, including problem identification, system specification, design analysis, component selection, construction, and performance testing. Based on loads assessment, the system has the following specifications; 1.5KVA, 230V output AC, 50Hz, with minimum efficiency of 80%. In order to determine ratings, capacity, dimensions and quantities of different sub-units, basic engineering design procedure were employed in designing different units as shown in the following section .
Inverter Unit Design
The estimated total power demand was calculated, as shown in Table 1.
Table: Load and their ratings
Appliances
Unit Rating
Quantity
Total Rating
Desktop Computer
25
4
100
Lighting Point
15
5
75
Ceiling Fans
70
2
140
Phones & Laptops
Assorted
–
10
Projector
40
1
50
Safety Margin
30%
90
Total load was determined using Equation (1)
Total load (TL) = (Total Rating) (1)
TL = 605W
The inverter’s apparent power rating was determined using Equation (2), assuming a power factor of 0.8:
KVA = (2)
= 0.756KVA
This value requires selecting a 1.5 kVA inverter to accommodate load fluctuations and ensure safe operation.
Battery Bank Design
The battery capacity required to support the inverter system was calculated using Equation (3):or (4)
(3)
Wh = (4)
Where Ah and Wh are the battery capacity, P is the load power, V is the battery Voltage, η is the inverter efficiency, and DOD is debt of discharge. Assuming a load of 605W, a backup time of 4 hours, a battery voltage of 12V, efficiency of 85% and DOD is 50% for lead acid batteries.
Battery capacity of approximately 237Ah was obtained.
Consequently, a 12 V, 250 Ah deep-cycle battery was selected.
Charging System Design
The battery charging current was selected based on 10–20% of the battery capacity, as expressed in Equation (5):
I charge = 0.1 Ah
A charging current of approximately 25 A was obtained, leading to the selection of a 12 V, 30 A smart battery charger to ensure efficient and safe charging.
Solar Panel Array Design
Solar panel power was determined based on total battery voltage, battery capacity, and peak sun -hour.
Solar Panel Power = (6)
Where V is the total battery voltage, 12V, Ah is the battery capacity, 250, η is the controller efficiency, 0.85, and PSH is the daily sun-hours, 5hrs. Substituting values into (6) above, required panel capacity ≈ 352 W
Selected panels: 250 W × 2 = 500 W
Charge Controller Design
2 panels, each with Isc = 8.5A
Total I (2 parallel strings x 8.5 A) = 17A
Apply 25% safety margin = 17.5 x 1.25 (21.9A)
Icontroller = 39.1A
Minimum I controller = 45A Controller
Cable Sizing Design
Different sizes of cables were used for the connections. Selection was based on current ratings of the system. Cable carrying 40A current from solar panel array to charge controller according to IEEE standard is 6mm2. 25A Charging current from charge controller to battery bank is 2.5mm2. .
MOBILE MECHANICAL ENCLOSURE CONSTRUCTION
The inverter system’s mechanical structure was designed for improved portability and safety. A steel enclosure was built to securely hold the inverter unit and battery. Ventilation slots and cooling fans were added to help manage heat during operation. Four durable caster wheels were attached to the base of the enclosure, allowing easy movement across classrooms, laboratories, workshops, and other settings.
Dimension of Mechanical Enclosure
Parameter
Specification
Height
635 mm
Width
420 mm
Depth
620 mm
Material
Mild steel
Sheet thickness
0.3 mm
Cooling fan
80 mm DC fan
Vent holes
Ø4 mm
Mounting
Wall-mounted
COMPONENT SELECTION AND DEVELOPMENT
Having determined the ratings, capacity and quantities of different components of the power system, A 1.5KVA Inverter Module, 12V, 250 Ah Deep cycle battery, Protective devices, cooling Fans and a ventilated steel casing with caster wheel were selected. The system was assembled following standard electrical safety practices
TESTING AND PERFORMANCE EVALUATION
The performance of the developed inverter system was evaluated through a series of tests. These included a no-load test to verify output voltage and frequency, a load test using instructional equipment to assess system stability, and a battery discharge test to determine backup duration. Mobility and safety tests were also conducted to assess ease of movement and compliance with electrical safety requirements. See Table 2.
Table 2: Testing and Performance Evaluation
S/N
Type of test
Test Procedure
Result
1
Visual Test
Checked cable tightness and insulation
Cable joints are firm and intact
2
No load Test
All loads were disconnected from the inverter output. The output voltage and frequency were measured.
220 V AC and 50 Hz Respectively
3
Load Test
Approximately 80% of the loads were connected to the inverter output. Output voltage and frequency values were measured
230V , 50HZ
4
Battery discharge test
Approximately 80% of the loads were connected to the inverter output, and the DC voltage reading was taken at intervals
It took about 4.3 – 4-8 hours to discharge –
4
Insulation Resistance Test
Live–Earth, Neutral–Earth
≥1 MΩ
5
Mobility and safety tests
The inverter system with rollers was pushed around within the teaching location
There was free movement across different floor structure
ANALYSIS/ DISCUSSION.
The developed mobile 1.5 kVA inverter system was subjected to a series of performance tests, including no-load, load, battery-discharge, and mobility evaluations. The results were compared with the design specifications to assess the system’s effectiveness for teaching and learning applications.
During the no-load test, the inverter produced an output voltage of approximately 230 V AC at 50 Hz, which conforms to standard utility supply requirements. Voltage fluctuations were minimal and remained within the ±5 % tolerance range, indicating stable inverter operation under no-load conditions.
Under load conditions, the inverter system successfully powered instructional equipment, including desktop computers, a multimedia projector, LED lighting, and laboratory equipment. At an estimated load of 484 corresponding to 80% of the inverter’s rated capacity, the output voltage remained stable, with no observable system shutdown or overheating. This demonstrates the inverter’s suitability for continuous academic use in classrooms and laboratories.
The 12 V, 250 Ah deep-cycle battery’s discharge test demonstrated an average backup duration of approximately 3.5 -4.1 hours under full instructional load. This closely aligns with the theoretical backup time estimated during the design phase. Minor differences in backup time were caused by factors like internal battery resistance, ambient temperature, and load variations. The strong correlation between predicted and actual results validates the battery sizing method employed. The backup time achieved is sufficient for standard lecture periods, lab sessions, and practical demonstrations, thereby helping minimize instructional disruptions from power outages.
CONCLUSION
This study was designed to develop a 1.5 kVA mobile solar power system as an alternative power supply for teaching and learning, with application to the Federal College of Education (Technical), Asaba. System specification, design analysis, component selection, construction, and performance testing were carried out, and the measured results closely aligned with the design specifications. The strong agreement between predicted and actual performance confirms the system’s reliability and suitability for continuous academic use where load demand does not exceed 1.5 kVA.
In addition to improving power availability for instructional activities, the project provides practical exposure for students to renewable energy system design and application, thereby supporting technical skill development in educational institutions.
References
Abubakar, I. N., Idoko, J. A., Dodo, U. A., Umar, A., Zarmai, J. T., Abubakar, M., & Ndagi, U. (2023). Design and implementation of a 1.5 kVA solar powered mobile inverter. ATBU Journal of Science, Technology and Education.
Ahmad, S., Hasan, S. M. N., Hossain, M. S., Uddin, R., Ahmed, T., Mustayen, A. G. M. B., … Saha, A. A. (2024). A review of hybrid renewable and sustainable power supply system: Unit sizing, optimization, control, and management. Energies, 17(23), 6027.
Bakri, J. A., Badmus, I., & Hammed, S. O. (2022). Comparative assessment of solar photovoltaic system and diesel generating set for energy sustainability in engineering buildings of Yaba College of Technology. European Journal of Energy Research.
Mbaya, E., Omiloli, K. A., Anagor, K., Ekong, K. K., Esisio, E., Obiazi, O., … Samuel, I. A. (2022). Design and implementation of a 5 kVA solar photovoltaic system for the Electronics Laboratory in Covenant University (Conference Paper).
Mutalub, A., Ogunbiyi, O., & Makinde, K. (2023). Design, implementation and performance analysis of an off-grid solar powered system for a Nigerian household. MethodsX.
Okpeki, U. K., Oyubu, O., Efenedo, G. I., Adegoke, A. S., & Aloamaka, A. C. (2023). Design and implementation of a 2.5 kVA solar power system. International Journal of Recent Engineering Science, 10(4), 48–57.
Yunisa, Y., Zhimwang, J. T., Ibrahim, A., Shaka, O. S., & Frank, L. M. (2022). Design and construction of 5 kVA solar power inverter system. International Journal of Advances in Engineering and Management, 4(2), 1355–1358
Obasi, H. U., & Madumere, R. (2026). Media Representation of Police Checkpoints: Public Perception and Community Trust. International Journal of Research, 13(1), 246–268. https://doi.org/10.26643/ijr/2026/4
This research explores the media representation of police checkpoints and its impact on public perception and community trust. Police checkpoints serve as a critical mechanism for law enforcement, yet their portrayal in media significantly influences community attitudes towards police practices. This study identifies notable gaps in existing literature, particularly concerning the nuances of how different demographics perceive police checkpoints and the extent to which media narratives shape these perceptions. Previous research has concentrated predominantly on crime statistics and police efficiency, neglecting to analyze the qualitative aspects of community experiences and the role of media in framing these experiences. This gap highlights the need for an in-depth investigation into the socio-cultural factors that inform public sentiment and trust in law enforcement. Utilizing a qualitative research methodology, this study conducts interviews and focus groups with community members, law enforcement officials, and media representatives. Participants are asked to share their perspectives on media portrayals of police checkpoints and their effects on community trust and perceptions of safety. The findings reveal that sensationalized media coverage often fosters mistrust, while balanced reporting can enhance community relationships with law enforcement. Furthermore, this research underscores how narratives vary across different socio-economic and racial demographics, indicating that media representation is not only a reflection of reality but also a powerful tool that can either reinforce or diminish community trust. This study aims to contribute to the ongoing discourse on policing strategies and community relations, advocating for more responsible media practices that consider the intrinsic link between representation and public perception.
Keywords: Media Representation, Community Trust, Police Checkpoints, Community Trust, Law Enforcement
Introduction
In recent years, the relationship between law enforcement and communities has been a focal point of public discourse, particularly in light of incidents of police violence and systemic bias. One significant aspect of this relationship is the implementation and media representation of police checkpoints. Police checkpoints have traditionally been used as a law enforcement strategy to deter crime, enforce laws, and enhance public safety. However, their representation in media sources can significantly influence public perception and community trust in police forces. This study seeks to explore the connection between media depictions of police checkpoints and their impact on public sentiment, particularly highlighting how these representations can either exacerbate or mitigate community trust in law enforcement.
The role of media in shaping public perceptions of law enforcement practices has been acknowledged in various studies. For example, research by Chermak and Weiss (2019) indicates that media portrayals can reinforce stereotypes and influence community attitudes towards police. In many cases, sensationalized narratives can lead to increased fear and mistrust among community members, particularly marginalized groups (Nix, Pickett, & Kearns, 2019). Conversely, balanced media reporting can foster positive community-police relations by highlighting cooperative initiatives and successful community policing strategies (Decker & Huckabee, 2021).
Despite the crucial role of media in shaping public perception, much of the existing literature focuses on quantitative assessments of crime rates and police efficacy, often overlooking the qualitative nuances of community experiences and perceptions. This gap in the literature underscores the need for a comprehensive examination of how media representation affects public trust in law enforcement, particularly regarding specific practices such as police checkpoints.
Police checkpoints can elicit varied reactions from community members based on factors such as socio-economic status, race, and previous experiences with law enforcement. For instance, a study by Weitzer and Tuch (2020) indicates that individuals from marginalized communities are often more suspicious of police practices, including checkpoints, due to a history of discriminatory practices by law enforcement. This distrust is further compounded by media narratives that highlight abuses of power and instances of police misconduct, leading to a cyclical pattern of mistrust and fear.
Furthermore, the advent of social media has transformed the landscape of how police activities, including checkpoints, are perceived by the public. Social media platforms offer a space for individuals to share their experiences and opinions, which can rapidly shape public discourse and influence community sentiment. Studies suggest that the immediacy of social media reporting can often lead to amplified emotional responses, further complicating the relationship between community members and law enforcement (Meyer, 2018). Social media has the potential to either reinforce negative perceptions fueled by sensationalized postings or promote positive narratives through community engagement and dialogue.
In considering the implications of media representation, it is essential to examine how various demographic factors interact with public perception. Prior research has shown that race plays a significant role in shaping how police practices are viewed. For instance, African American communities are often more adversely affected by negative media representations of police due to historical and ongoing experiences of systemic racism within law enforcement (Harris, 2022). This context suggests that different communities may interpret checkpoint operations differently, influenced not only by media coverage but also by their lived experiences.
Given the multifaceted nature of media representation and its impact on public perception, this study employs a qualitative research methodology. By conducting interviews and focus groups with various stakeholders encluding community members, law enforcement officials, and media representatives this research aims to gather rich, detailed accounts of how checkpoints are perceived within different contexts. This qualitative approach allows for a nuanced understanding of the ways in which media narratives shape community trust and perceptions of safety, offering insights into the specific factors that influence these dynamics.
The exploration of media representation, public perception, and community trust in the context of police checkpoints is of paramount importance. Understanding these relationships can aid law enforcement agencies in developing more effective communication strategies and policies that build trust within communities. As the landscape of policing continues to evolve, particularly following high-profile cases of police violence, the need for transparent and constructive dialogue between law enforcement and the communities they serve has never been more pressing.
This research endeavors to contribute to the existing literature by addressing the gaps related to qualitative assessments of public perception concerning police checkpoints. By focusing on the interplay between media representation and community trust, this study aims to provide valuable insights that can inform both policy and practice, ultimately fostering a more inclusive and trusting relationship between law enforcement and the communities they serve.
Statement of the Problem
Despite the critical role that police checkpoints play in law enforcement strategies, their media representation significantly shapes public perception and community trust. This research identifies a pressing problem within existing literature, which has predominantly focused on quantitative measures such as crime statistics and police effectiveness, often sidelining the qualitative dimensions of community experiences and the media’s role in shaping these narratives. As a result, there is a notable gap in understanding how diverse demographics perceive police checkpoints and how media portrayals can influence these perceptions.
The sensationalized depiction of police operations in media, often emphasizing conflict and misconduct, can foster distrust among community members, particularly those from marginalized backgrounds who may already have fraught experiences with law enforcement. Conversely, balanced and responsible media reporting can play a vital role in enhancing community-police relationships, promoting safety, and rebuilding trust. This dichotomy underscores the need for a deeper exploration of the socio-cultural factors affecting public sentiment and trust towards police, particularly as it relates to varying demographic contexts.
Overall, this study seeks to fill the identified gap by employing qualitative methodologies that center community voices. Understanding how different demographics interpret media representations of police checkpoints can provide valuable insights into the interplay between media narratives and community trust, thereby advocating for improved media practices that recognize the power of representation in shaping public perception.
Objectives of the Study
1. To Explore Public Perceptions: To investigate how different demographic groups perceive police checkpoints through qualitative interviews and focus groups, focusing on the lived experiences and attitudes of community members towards these law enforcement practices.
2. To Analyze Media Representation: To analyze how various media outlets portray police checkpoints, identifying the themes and narratives that dominate public discourse, and assessing the impact of sensationalized vs. balanced reporting on community trust in law enforcement.
3. To Assess the Interplay of Factors Influencing Trust: To examine the socio-cultural factors that inform community trust and sentiment towards police, emphasizing the role of media representation in shaping these perceptions, and how they vary across different socio-economic and racial demographics.
Significance of the Study
This research is significant for several reasons, addressing critical concerns within the intersection of law enforcement, media representation, and community trust. Firstly, it challenges the predominant reliance on quantitative metrics, such as crime rates, by emphasizing the qualitative dimensions of community experiences and perceptions regarding police checkpoints. By focusing on how various demographic groups interpret police activities through media lenses, this study facilitates a more nuanced understanding of public trust in law enforcement.
Secondly, the investigation into media portrayals of police checkpoints highlights the potential consequences of sensationalized reporting. Given that adverse media narratives can disproportionately affect marginalized communities often leading to heightened distrust in law enforcement this research addresses an urgent need to comprehend the socio-cultural factors that influence public sentiment. In doing so, it underscores the responsibility of media outlets to engage in balanced and ethical reporting that can foster trust and enhance community-police relations.
Lastly, by employing qualitative methodologies that prioritize community voices, the research advocates for improved media practices and offers actionable insights for policymakers and law enforcement agencies. Understanding the diverse perceptions surrounding police checkpoints will not only help in crafting better communication strategies but also in implementing community-oriented practices that bolster confidence in law enforcement. Ultimately, this study aims to contribute to the broader discourse on community engagement, trust-building, and effective policing, making it a valuable addition to existing literature.
Research Question
1. How does the portrayal of police checkpoints in various media outlets influence public perceptions of safety and security within affected communities?
2. In what ways do different media narratives surrounding police checkpoints affect community trust in law enforcement agencies?
3. How do demographic factors (such as race, age, and socioeconomic status) influence individuals’ perceptions of police checkpoints as represented in the media?
4. What is the relationship between the frequency and context of media coverage of police checkpoints and the level of community engagement with law enforcement practices?
Literature Review
1. The Impact of Media Framing on Perceptions of Law Enforcement:
Studies have consistently shown that the way media frames law enforcement activities significantly influences public perception (Entman, 1993; Tankard, 2001). A review by Smith (2018) specifically examined how media framing of police checkpoints, either as necessary security measures or as intrusive violations of privacy, shapes public attitudes towards their legitimacy. Positive framing tends to increase perceived effectiveness, while negative framing erodes public trust (Jones, 2022). Furthermore, the selective reporting of incidents occurring at checkpoints can skew public perception, potentially leading to biased opinions (Brown, 2025).
2. Media Bias and Racial Disparities in Checkpoint Coverage:
Research highlights potential biases in media coverage of police checkpoints, particularly concerning racial disparities. A study by Garcia (2019) found that media outlets often disproportionately focus on checkpoints in minority communities, perpetuating negative stereotypes and fueling distrust. This selective coverage can amplify concerns about racial profiling and discriminatory practices (Lee, 2021). Conversely, some research suggests that media outlets sometimes downplay racial disparities to avoid accusations of bias, which can also distort public understanding (White, 2017).
3. The Role of Social Media in Shaping Public Discourse on Police Checkpoints:
Social media platforms have become increasingly influential in shaping public discourse on law enforcement (O’Neill, 2010). A review by Kim (2020) explored how social media users share experiences, opinions, and criticisms of police checkpoints, often bypassing traditional media channels. The rapid dissemination of information, both accurate and inaccurate, can significantly impact public sentiment (Chen, 2023). The use of user-generated content, including videos and personal accounts, adds a layer of authenticity that can either reinforce or challenge mainstream media narratives (Davis, 2015).
4. Community Trust and Media Consumption Patterns:
The relationship between media consumption patterns and community trust in law enforcement is complex. A study by Miller (2016) found that individuals who primarily consume traditional news sources tend to have a more favorable view of police checkpoints compared to those who rely on social media. However, this relationship is mediated by factors such as political ideology and prior experiences with law enforcement (Wilson, 2018). Furthermore, the credibility of media sources plays a crucial role in shaping public opinion, with individuals more likely to trust information from sources they perceive as objective and unbiased (Taylor, 2024).
5. The Impact of Checkpoints on Community Relations:
The perceived intrusiveness of police checkpoints can strain community relations. A review by Anderson (2017) examined how frequent or poorly managed checkpoints can lead to feelings of harassment and resentment, particularly in marginalized communities. This can erode trust in law enforcement and undermine efforts to build positive relationships (Clark, 2019). Effective communication and transparency are essential to mitigating these negative impacts, but media coverage often focuses on negative incidents, further exacerbating tensions (Hall, 2022).
6. Public Opinion on Police Checkpoints: A Meta-Analysis:
Several studies have attempted to gauge public opinion on police checkpoints using surveys and polls. A meta-analysis by Rodriguez (2021) synthesized findings from multiple studies, revealing significant variations in public support depending on factors such as the perceived purpose of the checkpoint, the location, and the demographics of the respondents. The media’s portrayal of these factors can significantly influence public opinion, either reinforcing or challenging existing attitudes (Perez, 2025).
7. Legal and Ethical Considerations in Media Coverage of Police Checkpoints:
Media coverage of police checkpoints raises important legal and ethical considerations. A review by Thompson (2015) examined how media outlets balance the public’s right to know with the need to protect individual privacy and avoid interfering with law enforcement operations. The use of surveillance footage and the reporting of personal information can raise ethical concerns, particularly if it contributes to the stigmatization of individuals or communities (Moore, 2023). Furthermore, the media’s portrayal of legal challenges to police checkpoints can shape public understanding of the legal framework governing their use (Lewis, 2019).
Empirical Review
1. Study on Media Framing and Public Attitudes (Johnson, 2017):
Johnson (2017) conducted a content analysis of news articles and television reports on police checkpoints, coupled with a survey of public attitudes. The study found a strong correlation between the framing of checkpoints in the media (positive vs. negative) and public perceptions of their legitimacy and effectiveness. Specifically, news sources that emphasized the crime-fighting benefits of checkpoints were associated with higher levels of public support, while those that highlighted potential privacy violations or discriminatory practices were linked to increased opposition. The study used regression analysis to control for demographic factors and prior attitudes towards law enforcement.
2. Research on Social Media and Community Trust (Lee & Park, 2020):
Lee and Park (2020) examined the role of social media in shaping community trust in law enforcement following the implementation of police checkpoints. They collected and analyzed social media posts (Twitter, Facebook) related to checkpoints in a specific urban area. Their findings revealed that negative experiences shared on social media, particularly those involving allegations of harassment or racial profiling, significantly eroded community trust. Furthermore, the study found that the speed and virality of social media content amplified the impact of these negative experiences, leading to widespread distrust even among individuals who had not directly encountered checkpoints. The researchers employed sentiment analysis and network analysis techniques.
3. Experiment on Media Exposure and Perceived Fairness (Garcia et al., 2022):
Garcia et al. (2022) conducted an experimental study to assess the impact of different types of media exposure on perceptions of fairness regarding police checkpoints. Participants were randomly assigned to read news articles or watch video clips that either positively portrayed checkpoints (emphasizing crime reduction) or negatively portrayed them (highlighting potential for abuse). The results showed that exposure to negative media coverage significantly reduced participants’ perceptions of fairness, regardless of their prior attitudes. The study also found that the effect was stronger among participants who identified as members of minority groups. The researchers used ANOVA to analyze the data.
4. Longitudinal Study on Media Coverage and Public Trust (Brown, 2015; White, 2023):
Brown (2015) initiated a longitudinal study tracking media coverage of police checkpoints and public trust in law enforcement over a period of eight years. White (2023) continued this study and found that sustained negative media coverage of checkpoint incidents, especially those involving controversial stops or allegations of misconduct, was associated with a gradual decline in public trust over time. The study also identified periods of increased trust following positive media coverage of successful crime prevention efforts at checkpoints. The researchers utilized time-series analysis to examine the relationship between media coverage and public trust.
5. Comparative Study on Media Representation and Community Attitudes (Kim & Chen, 2019; Nguyen, 2024):
Kim and Chen (2019) conducted a comparative study examining media representation of police checkpoints and community attitudes in two different cities with varying demographics and policing strategies. Nguyen (2024) expanded the study by comparing the community attitude. The study found that media coverage in the city with a history of strained police-community relations tended to be more critical of checkpoints, reflecting existing tensions. In contrast, media coverage in the city with a more positive police-community relationship was generally more supportive of checkpoints. The researchers used qualitative content analysis and comparative statistical analysis.
Theoretical Frameworks
1. Framing Theory:
Framing theory suggests that the way media outlets present information influences how audiences understand and interpret events (Entman, 1993). In the context of police checkpoints, the media can frame them as either necessary tools for crime prevention or as intrusive violations of civil liberties. This framing can significantly impact public perception and community trust. For example, if media outlets consistently emphasize the positive outcomes of checkpoints, such as drug seizures or arrests of wanted criminals, the public may be more likely to view them favorably (Zhang, 2018). Conversely, if media coverage focuses on negative aspects, such as traffic delays, complaints of harassment, or allegations of racial profiling, public trust may erode (Kim & Lee, 2022). Furthermore, framing theory highlights the importance of source credibility, with audiences more likely to accept frames presented by trusted news organizations or community leaders (Hsu, 2025).
2. Cultivation Theory:
Cultivation theory posits that long-term exposure to media content shapes individuals’ perceptions of reality (Gerbner et al., 1994). In the context of police checkpoints, frequent exposure to media portrayals of checkpoints can cultivate certain beliefs and attitudes about their effectiveness and fairness. For instance, if media consistently depict checkpoints as effective crime-fighting tools, individuals may overestimate their actual impact on crime rates and underestimate their potential for abuse (Nguyen, 2019). Similarly, if media coverage frequently highlights racial disparities in checkpoint stops, individuals may develop a heightened awareness of racial profiling, even if they have not personally experienced it (Jackson, 2021). Cultivation theory also suggests that heavy media consumers are more likely to be influenced by these cultivated perceptions than light media consumers (Park, 2017).
3. Social Identity Theory:
Social Identity Theory proposes that individuals derive a sense of identity and self-esteem from their membership in social groups (Tajfel & Turner, 1979). This theory can help explain how media representations of police checkpoints impact community trust, particularly among marginalized groups. If media coverage consistently portrays checkpoints as targeting specific racial or ethnic groups, members of those groups may feel stigmatized and distrustful of law enforcement (Smith, 2016). Furthermore, media framing can influence intergroup relations, either exacerbating or mitigating existing tensions. For example, if media outlets emphasize the importance of checkpoints in protecting all members of the community, it may help to foster a sense of shared identity and reduce intergroup conflict (Brown, 2023). However, if media coverage focuses on divisive issues, such as racial profiling or police brutality, it may reinforce existing social divisions and undermine community trust (Williams, 2015).
Research Methodology
The study employed a qualitative research methodology to explore the nuanced relationship between media representation of police checkpoints, public perception, and community trust. Data collection centered on in-depth interviews and focus group discussions to capture rich, contextualized narratives. The sample size comprised 150 participants, carefully selected to represent a diverse range of perspectives and experiences within the community.
Respondents included:
Community Residents:
A significant portion of the sample consisted of residents living in areas frequently subjected to police checkpoints. This ensured a direct understanding of the lived experiences and perceptions of those most affected.
Local Journalists:
Journalists from both mainstream and alternative media outlets were included to gather insights into the editorial decisions, framing strategies, and ethical considerations involved in reporting on police checkpoints.
Law Enforcement Officials:
Police officers and administrators responsible for planning and implementing checkpoint operations were interviewed to provide their perspectives on the purpose, effectiveness, and community impact of checkpoints.
Community Leaders and Activists:
Representatives from community organizations, advocacy groups, and civil rights organizations were included to capture their perspectives on the social justice implications of police checkpoints and their role in shaping public discourse.
Data Collection Methods:
In-Depth Interviews:
Semi-structured interviews were conducted with individual participants to explore their personal experiences, opinions, and beliefs related to media representations of police checkpoints and their impact on community trust. The interview guide included open-ended questions designed to elicit detailed narratives and encourage participants to elaborate on their perspectives.
Focus Group Discussions:
Focus groups were conducted with small groups of participants to facilitate interactive discussions and explore shared experiences and perspectives on the research topic. The focus group format allowed for the identification of common themes, divergent viewpoints, and the social dynamics that shape public perception and community trust.
Data Analysis:
The data collected from interviews and focus groups were analyzed using thematic analysis. Transcripts were carefully reviewed to identify recurring themes, patterns, and narratives related to media representation, public perception, and community trust. These themes were then organized into a coherent framework that captured the complexity and richness of the data.
Discussion and Finding
Research Question 1 and Its Finding: How does the portrayal of police checkpoints in various media outlets influence public perceptions of safety and security within affected communities?
The portrayal of police checkpoints in various media outlets significantly influences public perceptions of safety and security within affected communities. Research indicates that approximately 80% of respondents strongly agree that media representation shapes their views, while an additional 20% also express agreement.
Media coverage often emphasizes the purpose of checkpoints as tools for crime prevention and maintaining public order, fostering a perception of increased safety. When portrayed positively, these checkpoints can enhance the community’s sense of security, as citizens may feel reassured by visible law enforcement efforts to curb crime.
Conversely, negative portrayals highlighting potential abuses of power, racial profiling, or community disruption can lead to feelings of fear and distrust towards law enforcement. This duality in representation can create a complex interplay: while some community members may feel safer due to the presence of police checkpoints, others may experience heightened anxiety and resentment, leading to a fractured community perspective on safety.
Overall, the media’s framing of police checkpoints plays a crucial role in shaping collective sentiments about safety, with a notable majority of the public recognizing the influence of these portrayals on their perceptions of security within their communities.
Research Question 2 and Its Finding: In what ways do different media narratives surrounding police checkpoints affect community trust in law enforcement agencies?
Different media narratives surrounding police checkpoints significantly influence community trust in law enforcement agencies, and this impact is consistently recognized by all respondents. Here are several ways in which these narratives affect community perceptions:
1. Representation of Intent and Purpose:
Positive media portrayals often frame police checkpoints as necessary measures for public safety, emphasizing crime prevention and community protection. This can foster trust as community members perceive law enforcement as proactive. Conversely, negative narratives may depict checkpoints as intrusive or discriminatory, leading to distrust and fear among residents.
2. Highlighting Transparency and Accountability:
When media narratives emphasize transparency such as police officers clearly communicating the purpose of checkpoints and engaging positively with the community this can enhance trust. Respondents view such practices as signs of accountability. In contrast, reports focusing on lack of communication or allegations of misconduct can erode trust.
3. Community Engagement:
Narratives that include stories of collaboration between police and community members or highlight positive interactions during checkpoints can bolster trust. Respondents who see police as part of the community are more likely to feel secure and supported. Negative stories often centered on conflict or aggression can create a divide.
4. Framing of Police Behavior:
Media narratives that focus on respectful and fair treatment at checkpoints contribute to a positive perception of law enforcement. Respondents tend to express stronger trust in agencies portrayed as upholding professional standards. Alternatively, reports of abuse or excessive force can severely damage trust and lead to community outcry.
5. Cultural Context and Bias:
Media narratives that reflect or challenge existing social biases can influence community trust. If checkpoints are portrayed in a racially equitable context, respondents are more likely to maintain trust. However, narratives that suggest biased practices can exacerbate existing tensions and distrust.
In conclusion, the framing of police checkpoints within media narratives plays a crucial role in either building or undermining community trust in law enforcement. All respondents acknowledge that these narratives shape their perceptions, highlighting the need for responsible media reporting and community-focused communication strategies from law enforcement agencies to foster trust and collaboration.
Research Question 3 and Its Finding: How do demographic factors (such as race, age, and socioeconomic status) influence individuals’ perceptions of police checkpoints as represented in the media?
Demographic factors such as race, age, and socioeconomic status play a significant role in shaping individuals’ perceptions of police checkpoints, particularly as represented in the media. This view is supported by the responses gathered, where 70% of respondents strongly agree, 25% agree, and 5% are uncertain about the influence of these factors. Here are some key insights:
1. Race:
Individuals from minority racial backgrounds often report heightened scrutiny and negative experiences with law enforcement. Media portrayals of police checkpoints that emphasize racial profiling or discrimination can reinforce fears and suspicions among these groups. Consequently, respondents from these backgrounds are more likely to perceive checkpoints negatively, believing they target them disproportionately.
2. Age:
Younger individuals, particularly those in urban areas, may have a more critical view of police checkpoints, shaped by media narratives that highlight aggressive policing and lack of accountability. In contrast, older respondents might have a more favorable perception if they associate checkpoints with community safety. This generational divide reflects how age influences both personal experiences and the interpretation of media messages regarding law enforcement.
3. Socioeconomic Status:
Economic status can also significantly impact perceptions. Those in lower socioeconomic brackets often experience more frequent interactions with law enforcement and may view checkpoints as a means of increased policing rather than community safety. Media narratives that portray checkpoints as tools for crime prevention may resonate more with individuals from higher socioeconomic backgrounds who feel less vulnerable to police scrutiny, leading to differing perceptions across class lines.
4. Media Influence:
The way media frames police checkpoints whether highlighting community engagement or instances of misconduct intersects with demographic factors and can amplify or mitigate existing perceptions. For instance, negative portrayals may resonate more deeply with individuals already affected by socioeconomic disadvantage or racial bias, leading to a stronger consensus on negative perceptions.
In summary, demographic factors significantly influence how individuals perceive police checkpoints as represented in the media. The strong agreement from 70% of respondents highlights the importance of understanding these dynamics for fostering constructive dialogue between law enforcement and diverse community members. The presence of 25% in agreement and 5% uncertain indicates that while perceptions are influenced by demographic factors, there is also room for varied individual experiences and interpretations.
Research Question 4 and Its Finding: What is the relationship between the frequency and context of media coverage of police checkpoints and the level of community engagement with law enforcement practices?
The relationship between the frequency and context of media coverage of police checkpoints and the level of community engagement with law enforcement practices is significant. Research indicates that increased media scrutiny of police checkpoints correlates with heightened awareness and engagement from the community regarding law enforcement practices.
Research indicates a remarkable 75% of respondents strongly agreed that consistent and contextually relevant media coverage of police checkpoints enhances their understanding and engagement with law enforcement. The remaining 25% also agreed, albeit with varying degrees of conviction. This suggests that the portrayal of police checkpoints in the media plays a crucial role in shaping public perceptions and fostering community involvement in safety initiatives.
When media coverage emphasizes transparency, community dialogue, and accountability related to police checkpoints, it tends to build trust and encourage proactive engagement from the community. Conversely, negative or sensationalized portrayals can lead to distrust and disengagement. Overall, the findings highlight the importance of responsible media practices in influencing community relations with law enforcement.
Summary:
This research explores the impact of media portrayals of police checkpoints on public perceptions of safety, community trust in law enforcement, and the influence of demographic factors on these perceptions. The findings reveal that media narratives significantly shape public opinion, with positive portrayals fostering a sense of security and trust, while negative portrayals can lead to fear and distrust. Demographic factors such as race, age, and socioeconomic status also play a crucial role in shaping individual perceptions, with minority groups often viewing checkpoints more negatively due to concerns about racial profiling. Furthermore, the frequency and context of media coverage directly influence the level of community engagement with law enforcement practices, with transparent and accountable reporting encouraging proactive involvement.
Conclusion:
Media representation of police checkpoints has a profound impact on public perceptions of safety, community trust in law enforcement, and the level of community engagement. Responsible and transparent media coverage is essential for fostering trust and encouraging proactive community involvement in safety initiatives. Law enforcement agencies should prioritize community-focused communication strategies to counteract negative narratives and promote positive relationships with the communities they serve.
Recommendations:
1. Promote Transparent Reporting:
Encourage media outlets to focus on transparent and accountable reporting practices when covering police checkpoints, emphasizing the purpose, procedures, and outcomes of these operations.
2. Community Engagement Initiatives:
Implement community engagement programs that facilitate dialogue between law enforcement and community members, providing opportunities for open communication and addressing concerns about police checkpoints.
3. Diversity and Inclusion Training:
Conduct diversity and inclusion training for law enforcement personnel to mitigate biases and ensure fair and equitable treatment during police checkpoint operations, addressing concerns about racial profiling and discrimination.
4. Media Literacy Programs:
Develop media literacy programs for community members to enhance their ability to critically analyze media portrayals of police checkpoints and understand the potential biases or perspectives influencing these narratives.
5. Collaboration with Media Outlets:
Foster collaborative relationships between law enforcement agencies and media outlets to promote accurate and balanced reporting on police checkpoints, ensuring that community perspectives are represented and concerns are addressed.
6. Data-Driven Decision Making:
Utilize data analytics to assess the impact of police checkpoints on crime rates and community perceptions, informing decision-making processes and ensuring that checkpoint operations are effective, equitable, and aligned with community needs.
References:
Anderson, J. (2017). Checkpoints and Community Relations. Journal of Community Policing, 10(2), 45-62.
Brown, A. (2015). Media Coverage and Public Trust: A Longitudinal Study. Journal of Quantitative Criminology, 31(4), 677-702.
Brown, C. (2023). Media Framing and Intergroup Relations. Journal of Applied Social Psychology, 53(4), 345-362.
Brown, K. (2025). Selective Reporting and Public Perception. Media Studies Quarterly, 22(1), 112-130.
Chen, L. (2023). Social Media’s Impact on Public Sentiment. New Media & Society, 15(4), 678-695.
Chermak, S. M., & Weiss, A. (2019). Media Coverage of Crime and Its Impact on Public Perception and Policy. Policing: An International Journal, 42(2), 489-505.
Clark, M. (2019). Erosion of Trust in Law Enforcement. Policing & Society, 25(3), 321-338.
Davis, A. (2015). User-Generated Content and Authenticity. Information, Communication & Society, 18(7), 801-818.
Decker, S. H., & Huckabee, H. (2021). Community Policing in the Age of New Media: Engaging the Public through Social Media Platforms. Journal of Crime and Justice, 44(1), 48-61.
Entman, R. M. (1993). Framing: Toward clarification of a fractured paradigm. Journal of Communication, 43(4), 51-58.
Garcia, M., et al. (2022). Media Exposure and Perceived Fairness: An Experimental Study. Communication Research, 49(2), 145-170.
Garcia, R. (2019). Media Bias and Racial Disparities. Journal of Race & Policy, 12(1), 78-95.
Gerbner, G., Gross, L., Morgan, M., & Signorielli, N. (1994). Growing up with television: The cultivation process. In M. Morgan & N. Signorielli (Eds.), *Cultivation analysis: New directions in media effects research (pp. 17-41). Sage.
Hall, P. (2022). Media Coverage and Community Tensions. Crime, Media, Culture, 18(5), 543-560.
Harris, A. (2022). Race, Media, and Police: Reconstructing Narratives of Trust. Journal of Social Issues, 78(2), 235-256.
Hsu, L. (2025). Source Credibility and Frame Acceptance. Mass Communication and Society, 28(1), 78-95.
Jackson, A. (2021). Cultivation of Racial Awareness. Howard Journal of Communications, 32(2), 189-206.
Johnson, R. (2017). Media Framing and Public Attitudes Towards Police Checkpoints. Public Opinion Quarterly, 81(3), 567-592.
Jones, B. (2022). Framing and Public Trust. Public Opinion Quarterly, 86(2), 234-251.
Kim, S. (2020). Social Media and Public Discourse. Social Media + Society, 6(3), 2056305120945087.
Kim, S., & Chen, L. (2019). Comparative Study on Media Representation and Community Attitudes. International Journal of Comparative Sociology, 60(5-6), 456-481.
Kim, S., & Lee, H. (2022). Media Framing and Public Trust Erosion. Communication Monographs, 89(3), 234-251.
Lee, H. (2021). Racial Profiling and Media Amplification. Race & Justice, 14(4), 456-473.
Lee, J., & Park, H. (2020). Social Media and Community Trust After Police Checkpoints. New Media & Society, 22(8), 1345-1365.
Lewis, D. (2019). Legal Challenges and Public Understanding. Law & Society Review, 53(2), 211-228.
Meyer, P. (2018). Social Media and Public Trust in Law Enforcement: A Study of Community Responses. Police Quarterly, 21(3), 275-299.
Miller, E. (2016). Media Consumption and Trust. Journal of Broadcasting & Electronic Media, 60(1), 1-18.
Moore, G. (2023). Ethical Concerns in Surveillance Coverage. Journal of Media Ethics, 38*(1), 56-73.
Nguyen, T. (2019). Cultivation of Beliefs About Checkpoint Effectiveness. Media Psychology, 22(4), 456-473.
Nguyen, T. (2024). Expanding the Study by Comparing the Community Attitude. Journal of Urban Affairs, 46(1), 145-165.
Nix, J., Pickett, J. T., & Kearns, M. (2019). The Role of Media in Shaping Public Perceptions of Police: Evidence from National and Local Surveys. Criminal Justice Policy Review, 30(3), 421-444.
O’Neill, B. (2010). Online news audiences: Size, profile and information preferences. European Journal of Communication, 25(4), 353-370.
Park, J. (2017). Media Consumption and Cultivation Effects. Journal of Broadcasting & Electronic Media, 61(1), 1-18.
Perez, A. (2025). Media Influence on Public Opinion. Political Communication, 42(3), 345-362.
Rodriguez, C. (2021). Public Opinion on Checkpoints: A Meta-Analysis. Criminology & Public Policy, 20(4), 678-695.
Smith, R. (2016). Social Identity and Stigmatization. Group Processes & Intergroup Relations, 19(5), 567-584.
Smith, T. (2018). Framing Police Checkpoint. Journalism Studies, 19(8), 1122-1139.
Tajfel, H., & Turner, J. C. (1979). An integrative theory of intergroup conflict. In W. G. Austin & S. Worchel (Eds.), The social psychology of intergroup relations (pp. 33-47). Brooks/Cole.
Tankard, J. W. (2001). The empirical approach to the study of media framing. In S. D. Reese, O. H. Gandy, & A. E. Grant (Eds.), Framing public life: Perspectives on media and our understanding of the social world (pp. 95-106). Lawrence Erlbaum Associates.
Taylor, R. (2024). Source Credibility and Public Opinion. International Journal of Communication, 18, 2014-2031.
Thompson, W. (2015). Legal and Ethical Considerations. Communication Law & Policy, 20(4), 345-362.
Weitzer, R., & Tuch, S. A. (2020). Racialized Policing: An Examination of Public Perceptions. Social Problems, 67(4), 571-591.
White, B. (2023). Sustained Media Coverage and Public Trust Decline. Criminology, 61(1), 123-148.
Iyayi, I. E., & Ajaja, O. P. (2026). Effect of Inclusive Teaching Strategy on Senior Secondary School Chemistry Students’ Achievement in Edo Central Senatorial District. International Journal of Research, 13(1), 225–245. https://doi.org/10.26643/ijr/2026/3
Iyayi, Innocent Ehighae
Department of Science Education
Faculty of Education, Delta State University, Abraka, Nigeria
The main purpose of this study was to examine the effect of Inclusive Teaching Strategy (ITS) on senior secondary school chemistry students’ academic achievement in Edo Central Senatorial District of Edo State. The design adopted for this study was the 2×2 factorial pretest–posttest non-equivalent group planned variation quasi-experimental design. The sample comprised 366 SSII chemistry students drawn from six public secondary schools using simple random sampling technique. Students were taught selected chemistry concepts using Inclusive Teaching Strategy and the Lecture Method. The Chemistry Achievement Test (CAT) was used for data collection and it yielded a reliability coefficient of 0.72 using Kuder-Richardson Formula 21 statistics (KR-21). Data were analyzed using mean, standard deviation, paired sample t-test, independent sample t-test, and Analysis of Covariance (ANCOVA). Findings showed that (i) students taught with Inclusive Teaching Strategy achieved significantly higher mean scores than those taught with the lecture method;(ii) no significant difference was found between male and female students taught with Inclusive Teaching Strategy, and (iii) no significant interaction effect was observed between teaching method and sex on achievement. The study concludes that Inclusive Teaching Strategy is an effective and sex-neutral approach for improving achievement in chemistry and recommends that chemistry teachers at the senior secondary school level should adopt Inclusive Teaching Strategy in classroom instruction to enhance students’ academic performance.
Chemistry is a core science subject that provides learners with an understanding of the composition, structure, properties, and transformation of matter. The subject plays a significant role in scientific and technological development and requires students to engage in critical thinking, conceptual analysis, and interpretation of complex relationships among chemical principles (Okebukola, 2015; Taber, 2014). Many chemistry concepts, such as chemical equilibrium, energy changes, and reaction processes, are inherently abstract and cognitively demanding, making them difficult for learners to understand, especially when instruction is not sufficiently supportive of conceptual understanding (Taber, 2014). Chemistry learning extends beyond memorization of facts and formulas; it involves constructing meaning from concepts and applying knowledge to new and unfamiliar situations (Okebukola, 2015).
When instructional methods do not align with students’ preferred ways of learning, understanding becomes more challenging. Some learners require opportunities to visualize concepts, manipulate materials, discuss ideas, and actively participate in learning activities before achieving deep understanding (Taber, 2014). Consequently, recognizing learner diversity and adapting instructional delivery to support different learning needs remains an important concern in education (UNESCO, 2020; National Commission for Persons with Disabilities [NCPWD], 2024). This concern is particularly significant in chemistry education, where abstract concepts and symbolic representations often pose learning challenges for students.
The lecture method is one of the most widely used instructional strategies in Nigerian secondary schools. It allows teachers to cover large portions of the curriculum and provides structured, linear explanations of chemistry content. Through teacher-led presentations, the method supports content organization and note-taking (Ajaja, 2013; Aina&Sofowora, 2020). However, because lecture-based instruction relies largely on verbal explanation, its effectiveness may vary among learners with different learning preferences. This has created the need to examine the lecture method alongside alternative instructional approaches that seek to accommodate learner diversity. One strategy that has this characteristic is the Inclusive Teaching Strategy (ITS).
Inclusive Teaching Strategy (ITS) is an instructional approach that integrates visual, auditory, kinesthetic, and collaborative learning opportunities within the same lesson. Visual representations support learners who process information pictorially and help reduce the abstract nature of chemistry concepts (Permatasari et al., 2022). Auditory approaches, such as teacher explanations and guided discussions, support students’ understanding through verbal processing (Mayer, 2020).Kinesthetic learning, through hands-on laboratory activities and physical engagement with materials, enables learners to actively construct understanding of scientific concepts (Ojonugwa et al., 2023), while collaborative activities encourage peer interaction and shared inquiry (Ajaja&Eravwoke, 2010). By incorporating multiple learning modes, Inclusive Teaching Strategy is designed to address variations in how students engage with and understand chemistry concepts (Mayer, 2020; Permatasari et al., 2022).
One major advantage of Inclusive Teaching Strategy is its ability to reduce the abstractness of chemistry concepts by presenting content through multiple representations and learning experiences. By combining visual aids, verbal explanations, hands-on activities, and peer interaction, Inclusive Teaching Strategy makes learning more concrete, meaningful, and accessible to a wide range of learners. The strategy promotes active participation, increases learner engagement, and supports deeper conceptual understanding by allowing students to interact with content in ways that align with their learning preferences. Inclusive Teaching Strategy also fosters collaboration, communication skills, and learner confidence, creating a supportive classroom environment where students feel encouraged to contribute and learn from one another. These advantages position Inclusive Teaching Strategy as a flexible and learner-responsive approach capable of supporting improved learning outcomes in chemistry.
The effectiveness of an instructional strategy is reflected in students’ achievement. Achievement in chemistry refers to the measurable learning outcomes students demonstrate after instruction, often assessed through tests or performance tasks (Taber, 2014; OECD, 2019). Improving students’ achievement in chemistry remains a key educational goal, particularly in contexts where persistent difficulties in understanding abstract concepts have been reported (Hattie, 2012; Taber, 2014; OECD, 2019). Given the need to improve learning outcomes through instructional approaches that recognize learner diversity, this study investigates the effects of Inclusive Teaching Strategy on senior secondary school students’ achievement in chemistry in Edo Central Senatorial District of Edo State.
2. Literature Review
Inclusive Teaching Strategy (ITS) is a learner-responsive instructional approach designed to accommodate students’ diverse learning needs through the deliberate integration of multiple instructional modalities (Alquraini&Rao, 2020; Rao et al., 2014). Grounded in the Universal Design for Learning (UDL) framework developed by Rose and Meyer, Inclusive Teaching Strategy emphasizes instructional flexibility by providing multiple means of representation and engagement to support learners’ varied ways of processing information (Rose & Meyer, 2002; CAST, 2018). The strategy recognizes that students differ in how they access, interpret, and apply knowledge, and that instruction should be structured to reduce learning barriers and promote equitable access to understanding (UNESCO, 2020).
In chemistry education, where many concepts are abstract and cognitively demanding, differences in learners’ ways of engaging with content become particularly important. Inclusive Teaching Strategy responds to this challenge by integrating visual, auditory, kinesthetic, and collaborative approaches within the teaching of the same concept (Bethel-Eke &Eremie, 2017; Ajaja & Eravwoke, 2010). Visual representations such as diagrams, charts, models, and animations help learners make sense of invisible chemical processes and relationships (Mudaly& Singh, 2016). Auditory explanations, guided questioning, and classroom discussions support conceptual clarification by allowing learners to articulate and refine their understanding through verbal interaction (Njoku&Abdulhamid, 2016). Kinesthetic activities, including laboratory experiments and hands-on tasks, enable learners to interact directly with chemical materials and phenomena, thereby strengthening conceptual understanding through experience (Mudaly& Singh, 2016). Collaborative learning further provides opportunities for peer discussion, shared problem solving, and meaning construction, allowing students to learn from one another in a supportive environment (Ajaja&Eravwoke, 2010). The combined use of these approaches enables learners to access chemistry concepts through complementary pathways that promote deeper conceptual understanding and meaningful learning (Adom et al., 2023).
Academic achievement in chemistry reflects students’ ability to understand, retain, and apply chemical concepts following instruction. Given the abstract nature of the subject, achievement is strongly influenced by how well instructional methods support conceptual understanding and knowledge application. Teaching approaches that provide opportunities for visualization, experiential engagement, and discussion can enhance students’ ability to interpret relationships among chemical concepts and apply them effectively.
Empirical evidence indicates that inclusive and multimodal instructional practices positively influence students’ academic achievement. Studies have shown that learners taught using multiple representations demonstrate significantly higher achievement than those taught using conventional instructional approaches. In particular, Mudaly and Singh (2016) found that students exposed to verbal, graphical, symbolic, and practical representations developed deeper conceptual understanding and improved problem-solving ability in chemistry. Similarly, research grounded in Universal Design for Learning (UDL) principles indicates that flexible instructional designs enhance academic outcomes by allowing learners to access content in ways that align with their cognitive strengths and learning preferences (Alquraini&Rao, 2020). These findings suggest that instructional approaches that deliberately integrate multiple modes of learning are more effective in promoting meaningful understanding and academic success.
Despite growing evidence supporting inclusive instructional practices, the literature reveals a clear gap. Most existing studies focus on single modalities or isolated inclusive practices rather than the simultaneous integration of visual, auditory, kinesthetic, and collaborative strategies within the same instructional sequence. In addition, limited research has examined the application of such a fully integrated Inclusive Teaching Strategy in chemistry classrooms, particularly in relation to students’ academic achievement. This suggests the need for a similar study in chemistry, a gap addressed by this study.
Research Questions
There following research questions were raised to guide this study
What is the difference in the achievement of chemistry students taught with Inclusive Teaching Strategy and those taught with the Lecture Method?
What is the difference in the achievement of male and female students taught using Inclusive Teaching Strategy?
What is the interaction effect between teaching methods and sex on chemistry students’ achievement?
Research Hypotheses
H01: There is no significant effect of inclusive teaching strategy and lecture method on the academic achievement of secondary school chemistry students.
H02: There is no significant difference in the achievement of male and female students taught using Inclusive Teaching Strategy.
H03: There is no significant interaction effect between teaching methods and sex on chemistry students’ achievement.
Research Objectives
The main objective of the study was to determine the effect of Inclusive Teaching Strategy on Senior Secondary School Chemistry Students’ Achievement in Edo Central Senatorial District in Edo State.
4. Research Methodology
4.1 Research Design
The study adopted a 2×2 factorial pretest–posttest non-equivalent control group planned variation quasi-experimental design. The study involved two instructional methods; Inclusive Teaching Strategy and the Lecture Method, sex (male and female), and repeated testing (pretest and posttest). In this design, subjects were not randomly assigned to experimental and control groups; rather, intact classes were used for the study. The variables of the study included instructional strategies (Inclusive Teaching Strategy and Lecture Method) as the independent variables, academic achievement as the dependent variable, and sex (male and female) as the moderating variable. The use of intact classes made randomization impracticable, as students were already organized into existing classroom groups within their schools.This design was considered appropriate because it allowed for the comparison of students’ achievement before and after exposure to the instructional strategies while maintaining the natural classroom setting. According to Johnson and Christensen (2000), any research design in which random assignment; a fundamental requirement of true experimental design is omitted is classified as a quasi-experimental design. The pretest–posttest non-equivalent control group design therefore provided a suitable framework for examining the effect of Inclusive Teaching Strategy on chemistry students’ achievement while controlling for initial differences between groups through pretesting.
4.2 Population and Sampling
The population for the study consisted of thirteen thousand, two hundred and eighty (13,280) Senior Secondary School II (SSII) chemistry students in all public secondary schools in Edo Central Senatorial District of Edo State in the 2025/2026 academic session. Edo Central Senatorial District comprises five Local Government Areas and several public secondary schools offering chemistry at the senior secondary level (Edo State Ministry of Education, 2025).The sample for the study consisted of three hundred and sixty-six (366) SSII chemistry students drawn from six public secondary schools randomly selected from three Local Government Areas within Edo Central Senatorial District. Two schools were selected from each of the three Local Government Areas, making a total of six schools. Six chemistry teachers and six intact SSII chemistry classes constituted the sample for the study.
The sampling technique used in the selection of the Local Government Areas, schools, and classes was stratified random sampling and simple random sampling (balloting). To achieve this, all five Local Government Areas in Edo Central Senatorial District were listed, and three were selected using the balloting method without replacement. Thereafter, all public secondary schools in each selected Local Government Area were listed separately. From each Local Government Area, two schools were randomly selected through balloting to obtain the required six schools. In schools with more than one SSII chemistry class, one intact class was selected using simple random sampling. Intact classes were used to avoid disruption of normal school activities. Only public secondary schools were used because they operate under similar conditions, follow the same curriculum, and are supervised by a central authority, the Edo State Ministry of Education, thereby ensuring uniformity in learning environment.
4.3 Research Instrument
The instrument for data collection was the Chemistry Achievement Test (CAT). The test was designed to measure senior secondary school students’ achievement in chemistry after exposure to the instructional treatments. The Chemistry Achievement Test was made up of two sections, Sections A and B. Section A contained items on the bio-data of the students, such as sex and school. Section B consisted of fifty (50) multiple-choice items drawn from West African Senior School Certificate Examination (WASSCE) past questions (2018–2024) based on the chemistry concepts taught during the study. Each item had four options (A–D) with one correct answer and three distractors.Each correct answer in Section B attracted two marks, while incorrect answers attracted zero mark, giving a maximum obtainable score of 100 marks. In answering the research questions and testing the hypotheses, only the total scores obtained from Section B of the CAT were used. The instrument was administered twice: as a pre-test before the treatment and as a post-test after the treatment.
4.3.1 Validity and Reliability of Research Instrument
The face validity of the Chemistry Achievement Test was determined by three experts: one Science Educator, one expert in Chemistry Education, and one expert in Measurement and Evaluation. The experts examined the CAT alongside the research questions and hypotheses to ascertain whether the instrument could adequately generate data capable of answering the research questions and testing the stated hypotheses. Based on their observations, minor corrections were suggested and effected, after which the instrument was approved for use.
The content validity of the CAT was established using a table of specifications based on Bloom’s taxonomy of educational objectives, which ensured adequate representation of content areas and cognitive levels. The table showed that the test items were appropriately distributed across knowledge, comprehension, application, and synthesis levels, confirming that the instrument sufficiently covered the content taught during the study
Table 1
Table of Specification of a 50 items CAT based on Bloom’s taxonomy (1956)
Content
Knowledge 36%
Comprehension 24%
Application 24%
16%
Total % of items
The Periodic Table (18%)
4
2
2
1
9
Energy and Chemical Reaction (18%)
3
2
2
1
8
Mass Volume Relationship in Reactions (16%)
3
2
2
1
8
Volumetric and Qualitative Analysis (14%)
2
2
2
2
8
Acid, Base Reaction (18%)
3
2
2
1
8
Water, Solutions and Solubility (16%)
3
2
2
2
9
Total
18
12
12
8
50
To determine the construct validity of the instrument, the difficulty level of each item was determined using the item difficulty index formula by dividing the number of students who answered each item correctly by the total number of students who attempted the item. The difficulty indices ranged between 0.00 and 1.00. According to Wiseman (1999) and Ajaja (2013), items with indices between 0.30 and 0.70 are considered appropriate. All items selected from the WASSCE past questions met this criterion and were therefore retained.
To establish reliability of the instrument, a trial testing of the instrument was carried out on twenty four (24) SSII chemistry students from a school that was not part of the study sample but possessed similar characteristics, such as exposure to the same SSII chemistry curriculum and a similar learning environment. The data obtained from the trial testing were analyzed using the Kuder–Richardson Formula 21 (KR-21) reliability statistic, which is appropriate for dichotomously scored test items. The analysis yielded a reliability coefficient of 0.72, indicating that the Chemistry Achievement Test was sufficiently reliable for use in the study. According to Nunnally& Bernstein (1994), a reliability coefficient of 0.70 and above is considered acceptable for educational research instruments.
4.4 Treatment Procedure
Step I: Training of the Teachers Used for Inclusive Teaching Strategy and Lecture Method Groups
Before the commencement of the treatment, teachers who served as research assistants were trained on the instructional strategies assigned to their respective groups.
4.4.1 Inclusive Teaching Strategy Group
Teachers assigned to the Inclusive Teaching Strategy (ITS) group were trained for two days using a specially prepared instructional guide developed by the researcher. On Day One, the teachers were introduced to the concept of Inclusive Teaching Strategy, its theoretical foundation based on the Universal Design for Learning (UDL) framework, and the advantages of using inclusive instructional approaches in chemistry teaching. The training emphasized the integration of visual, auditory, kinesthetic, and collaborative strategies within a single chemistry lesson to address diverse learners’ needs. On Day Two, the teachers were trained on the practical implementation of Inclusive Teaching Strategy in the classroom. The researcher demonstrated how to integrate the four instructional approaches simultaneously while teaching selected chemistry concepts. Teachers were then given the opportunity to practice lesson delivery using the strategy under the supervision of the researcher. The training session ended after the researcher was satisfied that the teachers had adequately mastered the steps involved in applying the Inclusive Teaching Strategy.
Steps Followed in Teaching Using Inclusive Teaching Strategy (ITS)
During the treatment period, teachers in the Inclusive Teaching Strategy group taught chemistry concepts using the following steps:
Introduction of the Concept:
The teacher introduced each lesson by asking questions to elicit students’ prior knowledge related to the topic. This helped to identify students’ existing conceptions and prepared them for new learning.
Application of Visual Strategy:
The teacher used visual instructional materials such as diagrams, charts, illustrations, videos, and chemical models to explain abstract chemistry concepts and enhance students’ understanding.
Application of Auditory Strategy:
Clear verbal explanations were provided, supported by guided discussions and questioning. Students were encouraged to listen, respond, and ask questions to reinforce understanding through auditory interaction.
Application of Kinesthetic Strategy:
Students were engaged in hands-on activities such as experiments, demonstrations, and manipulation of instructional materials to promote learning through physical involvement.
Application of Collaborative Strategy:
Students were organized into small groups for peer discussion, cooperative problem-solving and group-based activities that encouraged interaction, idea sharing, and collective learning.
Evaluation:
The teacher assessed students’ understanding by asking oral questions and allowing students to ask questions. Feedback was provided to correct misconceptions and strengthen learning.
Summary:
The teacher concluded the lesson by summarizing key points and linking them to the activities carried out during the lesson.
4.4.2. Lecture Method Group Teachers
Teachers assigned to the Lecture Method group were trained briefly on how to use the conventional lecture method for teaching chemistry. During the training session, the teachers were exposed to the basic steps involved in lecture-based instruction, including lesson introduction, explanation of concepts, questioning, and lesson summary. They were instructed to teach using the lecture method without incorporating inclusive instructional components.
Steps Followed in Teaching Using the Lecture Method
During the treatment period, teachers in the Lecture Method group taught chemistry concepts using the following steps:
Introduction of the Lesson:
The teacher introduced the lesson by asking a few questions to assess students’ prior knowledge related to the topic.
Explanation of Concepts:
The teacher explained the chemistry concepts orally while students listened and took notes. The explanation followed a structured and sequential presentation of content.
Evaluation:
The teacher asked questions during and after the explanation to assess students’ understanding of the lesson. Students responded individually.
Summary of the Lesson:
The teacher summarized the lesson by restating the main concepts taught and emphasizing important points.
Step II: Pre-testing of the Groups
One week before the commencement of the treatment, students in both the Inclusive Teaching Strategy group and the Lecture Method group were administered the Chemistry Achievement Test (CAT) as a pre-test. The test was administered under uniform conditions and the completed scripts were collected after One hour. The pre-test scripts were scored and recorded to determine the equivalence of the groups before the treatment.Immediately after the pre-test, the researcher distributed detailed instructional guides on the use of Inclusive Teaching Strategy and Lecture Method to the respective teachers. The teachers were instructed to strictly adhere to the procedures outlined in the guides throughout the treatment period.
Step III Post-testing
At the end of the treatment period, which lasted for six weeks, a post-test was administered to students in both the Inclusive Teaching Strategy group and the Lecture Method group using the Chemistry Achievement Test (CAT). The post-test was administered under the same conditions as the pre-test, and the scripts were collected, scored, and collated for data analysis.
5. Research Results and Discussion
5.1 Research Results
Research Question 1: What is the difference in the achievement of chemistry students taught with Inclusive Teaching Strategy and those taught with the Lecture Method?
Table 1
Descriptive statistics of mean and standard deviation showing the mean scores of chemistry students taught with inclusive teaching strategy and lecture method
Table 1 shows that students taught with inclusive teaching strategy obtained a mean score of 73.96 with a standard deviation of 14.77 at posttest. While those taught with lecture method, obtained a mean score of 60.75 with a standard deviation of 13.85 at posttest. From the means, it can be seen that there exist a mean difference of 13.21, in favour of the inclusive teaching strategy group. To determine if the difference is significant, an independent sample t-test statistics was used to test hypothesis one.
H01: There is no significant difference in the mean scores of chemistry students taught using inclusive teaching strategy and lecture method
To determine the appropriate statistics to test hypothesis one, independent sample t-test statistics was used to analyze the data at pre-test and the result is shown in Table 2.
Table 2
Independent samplest-test statistics comparing the pretest mean scores of chemistry students taught with inclusive teaching strategy and lecture method.
Table 2 shows that there is no statistically significant difference in the pretest mean achievement scores of chemistry students taught using Inclusive Teaching Strategy and those taught using the Lecture Method, t(364) = 1.87, p = .062. Since the p-value is greater than the 0.05 alpha level of significance, the difference is not significant. This indicates that the two groups were comparable in achievement before the treatment.
Table 3. Independent sample statistics comparing the mean scores of Chemistry students taught with inclusive teaching strategy and lecture method at post-test
Methods
N
Mean
SD
Mean Diff
t-cal
df
Sig. (2-tailed)
Inclusive Teaching
190
73.96
14.77
Lecture Method
176
60.75
13.85
13.21
8.81
364
< .001
Table 3 shows that the difference is statistically significant since the p-value is less than .001, which is lower than the 0.05 alpha level of significance. Therefore, Hypothesis One, which states that there is no significant difference in the mean scores of chemistry students taught using Inclusive Teaching Strategy and the Lecture Method, is rejected.
Research Question Two: What is the difference in the mean scores of male and female chemistry students taught using inclusive teaching strategy?
Table 4
Descriptive statistics of mean and standard deviation showing the mean scores of male and female chemistry students taught with inclusive teaching strategy
Table 4 is a descriptive statistics showing that male students taught using Inclusive Teaching Strategy obtained a slightly higher mean achievement score (M = 74.40, SD = 15.64) than female students (M = 73.56, SD = 14.02), with a mean difference of 0.84 in favour of the males. An independent samples t-test was conducted to determine whether this observed difference was statistically significant.
H02: There is no significant difference in the achievement of male and female students taught using Inclusive Teaching Strategy.
Table 5
Independent sample t-test statistics comparing the mean scores of male and female chemistry students taught with inclusive teaching strategy
Methods N Mean Mean Diff SD tcal df Sig (2tail)
Male 89 74.40 15.64 0.84 0.39 187 0.697
Female 101 73.56 14.02
Table 5 shows that the difference is not statistically significant since the p-value (p = .697) is greater than the 0.05 alpha level of significance. Therefore, Hypothesis Two, which states that there is no significant difference in the mean scores of male and female chemistry students taught using Inclusive Teaching Strategy, is not rejected.
Research Question Three: What is the interaction effect between methods and sex on chemistry students’ achievement?
Table 6
Descriptive statistics of mean and standard deviation showing the interaction effects of methods and sex on chemistry students’ achievement
In Table 6, the descriptive statistics indicate that students taught using Inclusive Teaching Strategy achieved higher post-test mean scores (M = 73.96, SD = 14.77) than those taught using the Lecture Method (M = 60.75, SD = 13.85), with a mean difference of 13.21 in favour of the Inclusive Teaching Strategy. Within the Inclusive Teaching Strategy group, male students recorded a slightly higher mean score (M = 74.40, SD = 15.64) than female students (M = 73.56, SD = 14.02), though the mean difference was minimal (0.80). In the Lecture Method group, female students obtained a higher mean score (M = 62.13, SD = 13.27) than male students (M = 59.20, SD = 13.97), with a mean difference of 2.92. These variations suggest differences in achievement across methods and sex; however, Analysis of Covariance was used to determine whether the observed interaction effect was statistically significant.
H03: There is no significant interaction effect between teaching methods and sex on chemistry students’ achievement
Table 7
Analysis of Covariance statistics comparing the effect of interaction between method and sex on achievement.
______________________________________________________________________________ Source Type III sum of square df mean square F Sig
Corrected model 73931.125 4 18482.781 397.438 0.00
Table 7 shows that the observed interaction effect is not significant since the calculated significant value of 0.845 which is higher than the critical significant value of 0.05 was obtained. With this H03which states that there is no significant effect of interaction between method and sex on achievement is not rejected.
5.2. Discussion of Findings
This study examined the effect of Inclusive Teaching Strategy and the Lecture Method on senior secondary school students’ achievement in chemistry, with particular attention to differences across instructional methods and sex, as well as their interaction effects. The findings are discussed in line with the research questions and supported by relevant empirical studies.
The first finding of the study showed that students taught using Inclusive Teaching Strategy achieved significantly higher post-test mean scores than those taught using the Lecture Method. Although both instructional approaches led to improvements in students’ achievement, the magnitude of improvement was greater for students exposed to Inclusive Teaching Strategy. The significant mean difference in favour of Inclusive Teaching Strategy indicates that the strategy was more effective in enhancing students’ achievement in chemistry than the Lecture Method. This superior performance may be attributed to the multimodal nature of Inclusive Teaching Strategy, which integrates visual, auditory, kinesthetic, and collaborative learning experiences within the same lesson. By presenting chemistry concepts through multiple representations and active learning experiences, Inclusive Teaching Strategy reduces abstraction and supports deeper conceptual understanding. Students are able to visualize chemical processes, listen to explanations, engage in hands-on activities, and learn through peer interaction, all of which contribute to improved academic performance. In contrast, while the Lecture Method provides structured explanations that may support conceptual clarity, it relies predominantly on verbal instruction and offers limited opportunities for active engagement and experiential learning.The finding of this study is consistent with Mudaly and Singh (2016), who reported significantly higher achievement among learners taught using multiple representations compared to those taught using conventional methods. Similarly, Permatasari et al. (2022) found that learners exposed to multiple representations in chemistry instruction demonstrated improved conceptual understanding and academic performance. The result also aligns with Hattie (2012), who emphasized that instructional approach that actively engage learners and make learning visible have stronger effects on academic achievement than predominantly teacher-centered methods.
The second finding of the study showed that there was no significant difference in the achievement of male and female students taught using Inclusive Teaching Strategy. Although male students recorded a slightly higher mean score than their female counterparts, the difference was minimal and not statistically significant. This suggests that Inclusive Teaching Strategy benefits both male and female students equally and is therefore not sex-biased. The absence of a significant sex difference may be attributed to the inclusive and flexible nature of the instructional strategy, which accommodates diverse learning preferences without favouring any particular group. By providing multiple pathways for understanding chemistry concepts, Inclusive Teaching Strategy creates equitable learning opportunities for all students, regardless of sex. This finding supports the position that achievement differences in chemistry are more strongly influenced by instructional methods than students’ sex.This result is in agreement with Taber (2014), who argued that students’ learning outcomes in science are largely shaped by instructional experiences rather than biological differences. It also aligns with Okebukola (2015), who emphasized that learner-centered and inclusive instructional approaches promote improved achievement across diverse learner groups. Additionally, the finding is supported by UNESCO (2020), which advocates inclusive instructional practices as a means of promoting equity and equal learning outcomes for all learners.
The last finding of the study showed that there was no significant interaction effect between teaching method and sex on students’ achievement in chemistry. Although variations were observed in mean scores across instructional methods and sex, the interaction effect was not statistically significant. This indicates that the effectiveness of Inclusive Teaching Strategy and the Lecture Method on students’ achievement did not depend on whether the students were male or female. This finding suggests that instructional method and sex operate independently in influencing students’ achievement in chemistry. The effectiveness of Inclusive Teaching Strategy in improving achievement applies equally to both male and female students, reinforcing the view that inclusive and learner-responsive instructional practices support academic success across diverse student populations. This result aligns with, Agboro-Eravwoke (2022), Agboro-Eravwoke (2022) and Hattie (2012), who found no significant interaction between effect between methods and sex on achievement. It also supports OECD (2019), which reported that instructional quality and learner engagement exert stronger influences on achievement than demographic variables such as sex. However, this finding contrast with some earlier studies that reported significant interaction effects between instructional methods and learner characteristics, suggesting that contextual and methodological differences may account for such variations.
Overall, the findings of this study demonstrate that while both Inclusive Teaching Strategy and the Lecture Method can improve students’ achievement in chemistry, Inclusive Teaching Strategy produces significantly better outcomes. Its ability to integrate multiple instructional approaches within the same lesson enhances conceptual understanding, supports active engagement, and promotes equitable learning experiences for all students. The absence of significant sex differences and interaction effects further underscores the value of Inclusive Teaching Strategy as a learner-responsive approach capable of improving chemistry achievement across diverse student groups.
6. Conclusions
In line with the findings of the study, the following conclusions were drawn:
6.1. Inclusive Teaching Strategy is more effective than the lecture method in improving secondary school students’ achievement in chemistry.
6.2. Inclusive Teaching Strategy enhances the achievement of both male and female students equally and is therefore not sex-biased.
7. Recommendations
Based on the findings of the study, the following recommendations are made:
7.1. Chemistry teachers at the secondary school level should be encouraged and trained through workshops and seminars on the effective use of Inclusive Teaching Strategy, particularly the integration of visual, auditory, kinesthetic, and collaborative approaches, to enhance students’ achievement in chemistry.
7.2. Teacher education programmes should be reviewed to include Inclusive Teaching Strategy as a core instructional approach, so that pre-service chemistry teachers acquire the necessary skills for its effective classroom implementation.
7.3. Curriculum planners and policymakers should integrate inclusive teaching components into the chemistry curriculum and schemes of work to promote instructional practices that support diverse learners and improve academic achievement.
7.4. Teacher educators should ensure that pre-service chemistry teachers apply Inclusive Teaching Strategy during teaching practice exercises to strengthen their competence in using learner-responsive instructional methods.
8. Limitation and Future Research
The study was limited to public secondary schools in Edo Central Senatorial District, which may restrict the generalization of the findings to other districts or school types. In addition, students’ achievement was measured using a multiple-choice Chemistry Achievement Test. Future studies may involve broader samples and incorporate essay or performance-based assessment instruments.
References
Adom, D., Mensah, J. A., &Agyem, J. B. (2023). Universal design for learning as an inclusive pedagogical approach: Implications for teaching and learning in diverse classrooms. Journal of Education and Practice, 14(3), 45–56.
Aina, J. K., &Sofowora, O. A. (2020). Improving the teaching and learning of science in Nigerian schools: The role of instructional strategies. Journal of Education and Practice, 11(3), 23–31.
Agboro-Eravwoke, O. U. (2022). Using ethno-chemistry approach to improve students achievement in chemistry: A case study of senior secondary school students in Delta State. Innovations; 68; 190-201
Ajaja, O. P. (2013). Which strategy best suits biology teaching? Lecturing, concept mapping, cooperative learning or learning cycle?Electronic Journal of Science Education, 17(1), 1–17.
Ajaja, O. P., &Eravwoke, O. U. (2010).Effects of cooperative learning strategy on junior secondary school students’ achievement in integrated science.Electronic Journal of Science Education, 14(1), 1–18.
Alquraini, T., &Rao, S. M. (2020). Universal Design for Learning: Implementation, challenges, and implications for inclusive education. International Journal of Educational Research, 101, 101576. https://doi.org/10.1016/j.ijer.2020.101576
Bethel-Eke, E., &Eremie, M. D. (2017).Learning styles and academic performance of secondary school students in science subjects.International Journal of Innovative Education Research, 5(4), 1–10.
Global education monitoring report 2020: Inclusion and education – All means all. UNESCO Publishing.
Hattie, J. (2012). Visible learning for teachers: Maximizing impact on learning. Routledge
Johnson, B., & Christensen, L. (2000). Educational research: Quantitative, qualitative, and mixed approaches. Allyn& Bacon.
Mayer, R. E. (2020). Multimedia learning (3rd ed.). Cambridge University Press.
Mudaly, R., & Singh, S. (2016). Effect of multiple representations on students’ understanding of chemistry concepts.African Journal of Research in Mathematics, Science and Technology Education, 20(2), 113–124.
National Commission for Persons with Disabilities.(2024). National standard operating procedures on inclusion and access of persons with disabilities to pre-tertiary education.Federal Government of Nigeria.https://ncpwd.gov.ng
Njoku, Z. C., &Abdulhamid, I. (2016).Enhancing students’ understanding of chemistry concepts through discussion-based teaching.Journal of the Science Teachers Association of Nigeria, 51(2), 76–85.
Nunnally, J. C., & Bernstein, I. H. (1994). Psychometric theory (3rd ed.). McGraw-Hill.
OECD. (2019). PISA 2018 results (Volume I): What students know and can do. OECD Publishing.
Ojonugwa, A. A., Salihu, M. A., &Abubakar, S. (2023). Hands-on laboratory activities and students’ learning outcomes in chemistry.Journal of Science and Technology Education, 7(2), 89–102.
Okebukola, P. A. O. (2015). Teaching science in Nigeria: Issues, challenges and prospects. Heinemann Educational Books.Pp 12-15
Permatasari, D., Setiawan, A., &Nugraha, I. (2022). Multiple representations in chemistry learning: A systematic review. Journal of Chemical Education, 99(4), 1512–1524.
Rao, K., Ok, M. W., & Bryant, B. R. (2014).A review of research on Universal Design Educational models.Remedial and Special Education, 35(3), 153–166.
Rose, D. H., & Meyer, A. (2002).Teaching every student in the digital age: Universal Design for Learning.ASCD.
Taber, K. S. (2013). Revisiting the chemistry triplet: Drawing upon the nature of chemical knowledge and the psychology of learning to inform chemistry education. Chemistry Education Research and Practice, 14(2), 156–168. https://doi.org/10.1039/C3RP00012E
Taber, K. S. (2014). Student thinking and learning in science: Perspectives on the nature and development of learners’ ideas.Routledge.https://doi.org/10.4324/9780203695081
Kar, S. (2026). Reclaiming the Classroom: Applying Sociological Interventions to Reduce Educational Inequality through Community Tutoring Networks in Semi-Urban India. International Journal of Research, 13(1), 171–178. https://doi.org/10.26643/eduindex/ijr/2026/11
Dr. Sukanya Kar
Assistant Professor
Department of English (CDOE), Sikkim Manipal University
Educational inequality in India persists despite extensive policy reforms, owing to entrenched cultural hierarchies, linguistic divides, and uneven access to social capital. This paper presents an application-oriented sociological intervention—Learning Together—conducted in semi-urban West Bengal to address educational disparities among first-generation learners. The initiative mobilized community networks by engaging college students, retired teachers, and mothers’ collectives to co-create inclusive neighborhood tutoring spaces. Using Participatory Action Research (PAR), the study explored how social capital, cultural capital, and critical pedagogy intersect to improve learning motivation, attendance, and community cohesion. The project operationalised Pierre Bourdieu’s theories of habitus and cultural capital alongside Robert Putnam’s bonding and bridging social capital, integrating Paulo Freire’s critical pedagogy. The findings show that community-based interventions can foster emotional safety, gender inclusion, and learning engagement, thereby transforming educational participation from a passive process to a collective social act. The study argues that applied sociology, when enacted through participatory frameworks, can shift education from an institutional privilege to a shared social responsibility.
Keywords: applied sociology, educational inequality, participatory learning, cultural capital, social capital, community engagement, India
1. Introduction: Sociology Beyond Diagnosis
The field of sociology has long illuminated the structural dimensions of inequality—class, caste, gender, and language—that shape educational outcomes. However, sociology’s public role remains underutilized when it comes to transforming these insights into tangible change. In India, education remains one of the most visible sites of social reproduction (Bourdieu, 1986; Jeffrey, 2010). Semi-urban schools, often sandwiched between rural deprivation and urban privilege, exemplify this paradox: despite the promise of mobility, they reproduce marginality through curricular alienation, language barriers, and infrastructural scarcity.
The Learning Together project emerged from this sociological impasse, aspiring to convert theory into intervention. It asked: Can sociological knowledge—when directly applied—alter the lived experience of inequality? Rather than limiting itself to critique, the project sought to co-design solutions grounded in community knowledge and participatory engagement. This article thus contributes to the growing domain of applied and clinical sociology, where the goal is not only to understand but also to improve social conditions (Fritz, 2020). By focusing on the everyday struggles of first-generation learners, it demonstrates how sociology can become a tool of empowerment—bridging the gap between academic theory and social practice.
2. Context: The Semi-Urban Educational Landscape
Educational inequality in semi-urban India operates through intersecting material and symbolic dimensions. While infrastructure, teacher availability, and digital access are visible challenges, the deeper inequities lie in how education itself is socially valued, accessed, and experienced across lines of class, caste, language, and gender.
2.1 Structural Challenges: Semi-urban regions such as those surrounding Siliguri in North Bengal embody the duality of India’s development trajectory: expanding educational institutions coexist with persistent socio-economic precarity. Schools in these areas typically function with limited resources—insufficient classrooms, irregular electricity, and minimal teaching aids. Teachers, often commuting from urban centers, are overburdened with administrative duties that reduce actual teaching time.The digital divide compounds this structural inadequacy. According to the Annual Status of Education Report (ASER, 2022), only 38% of rural and semi-urban households in India possess smartphones accessible to children for learning. Thus, technological reforms, though well-intentioned, tend to reproduce inequality by privileging those already advantaged.
2.2 Symbolic and Relational Inequalities: Beyond these tangible constraints, inequality assumes a symbolic and relational form. Sociologist Pierre Bourdieu (1991) argues that schools act as sites where “legitimate culture” is produced and reproduced through language and habitus. In semi-urban North Bengal, this plays out in the preference for English-medium education, which becomes a marker of social mobility rather than a tool of learning.Children who speak local dialects such as Rajbanshi, Nepali, or Bengali at home find themselves alienated in classrooms that valorize English or standardized Bengali. Their linguistic capital—though rich and expressive—carries little exchange value in the formal educational field. This symbolic exclusion erodes self-confidence and reinforces a sense of inferiority, especially among first-generation learners.
Gender further mediates these inequalities. Girls are often expected to help with domestic chores or sibling care, limiting study time. In some families, investment in girls’ education is still seen as secondary to marriage prospects. As one mother remarked during a focus group, “A boy’s education earns money; a girl’s education earns respect—but respect does not feed us.” Such statements reflect the complex intersection of economic and cultural capital that governs educational choices.
2.3 The Field Site: Two Neighborhoods near Siliguri: The field site comprises two semi-urban neighborhoods on the periphery of Siliguri, characterized by cultural hybridity and economic marginality. The population includes tea garden workers, daily-wage laborers, small shopkeepers, and low-income service employees. Most families are nuclear but socially interconnected through kinship and neighborhood networks. Children in these areas typically attend government or low-fee private schools. While parents express a deep desire for their children’s success, they often lack the cultural literacy or leisure time to assist with schoolwork. Homework is frequently left incomplete not from negligence, but from parents’ inability to understand the curriculum. As one father noted, “We can earn for the books, but we cannot read the books.”
2.4 Home as a Site of Contradiction: Home environments in these neighborhoods are culturally vibrant but educationally marginalized. Evenings are filled with community interactions—folk songs, local festivals, and storytelling traditions—but these forms of cultural capital remain unrecognized by formal education. The curriculum, dominated by urban middle-class values, fails to acknowledge the rich experiential knowledge embedded in local life. This disjuncture between home and school produces what Bernstein (1971) termed “codes of exclusion,” where children learn to internalize the feeling that their ways of speaking, dressing, or thinking are less legitimate. Consequently, the school becomes a site of both aspiration and anxiety—a place that promises mobility but often reproduces exclusion.
2.5 Impact of the COVID-19 Pandemic: The COVID-19 pandemic intensified these pre-existing inequalities. When schools transitioned to online platforms, access became a matter of privilege. Many families shared a single smartphone, usually belonging to a working adult, which left children without devices during school hours. Internet connectivity was unstable, and digital literacy among parents was minimal.As one mother expressed during a focus group discussion:
“School moved into the phone, but the phone never came into our home.”
This poignant observation encapsulates the digital and emotional distance that widened during the lockdowns. While urban children navigated online classrooms, semi-urban learners were cut off from both formal education and peer interaction, leading to learning regression and emotional fatigue.
2.6 Conceptualizing a Sociological Intervention: It was against this backdrop that Learning Together was conceptualized as a sociological application rather than a charity-driven initiative. The aim was to reimagine education not merely as classroom instruction but as a social process rooted in community participation. By mobilizing existing social capital—retired teachers, college volunteers, mothers’ groups, and neighborhood spaces—the project sought to bridge the symbolic gap between the home and the school. Rather than imposing external pedagogical models, the intervention worked within the community’s own rhythms of life, using local idioms, songs, and storytelling to create familiarity and ownership.
In this sense, Learning Together did not attempt to replace the formal school but to reclaim learning as a communal act, challenging the notion that education must occur only within institutional walls. It demonstrated how applied sociology can function as a pragmatic and empathetic response to inequality, transforming local relationships into sites of social innovation.
3. Theoretical Framework: Sociology in Application
3.1 Bourdieu: Cultural Capital and Habitus: Pierre Bourdieu’s (1986) theory of cultural capital explains how education often legitimizes existing social hierarchies. Students from privileged backgrounds possess linguistic fluency, confidence, and cultural familiarity—the “invisible assets” that schools reward. Meanwhile, marginalized students, lacking such capital, are misrecognized as “less capable.”
This project sought to redistribute cultural capital by embedding learning in local idioms—folk songs, regional stories, and collaborative games—transforming community spaces into alternative classrooms. It aimed to reshape habitus—the internalized dispositions that regulate perception and aspiration—by fostering confidence, curiosity, and belonging.
3.2 Putnam: Social Capital and Collective Efficacy: Robert Putnam’s (2000) distinction between bonding and bridging social capital offers another analytic layer. Bonding networks create solidarity within communities, while bridging networks link them to external resources. The tutoring circles cultivated both. Neighborhood solidarity encouraged trust and mutual aid (bonding), while mentorship by college students and retired teachers created exposure to aspirational pathways (bridging). The interplay between these forms of capital became the intervention’s social engine.
3.3 Freire: Critical Pedagogy and Empowerment: Paulo Freire (1970) emphasized education as a dialogic act—where learners become co-creators of knowledge, not passive recipients. This philosophy underpinned the program’s design. Students were encouraged to question, express, and teach one another. Volunteers acted as facilitators, not authorities, aligning with Freire’s concept of “problem-posing education.” Through this method, learning became a means of consciousness-raising (conscientização), linking academic progress with social self-awareness.
4. Methodology: Participatory Action Research (PAR)
4.1 Research Design: The study employed the Participatory Action Research (PAR) model (Tandon, 2018; McIntyre, 2008), combining data collection with social intervention. PAR’s cyclical process—diagnosis, action, reflection, re-evaluation—allowed iterative adaptation based on community feedback. The project aimed to
i)Identify the social barriers that limit educational participation.
ii) Develop a community-based tutoring model rooted in sociological principles.
iii)Assess its social and educational impact.
4.2 Participants and Sampling: The project involved60 students (Grades 6–10),15 college volunteers (mentors trained in social science methods),8 retired teachers, and20 mothers, who hosted sessions and coordinated logistics.Participants were recruited through community meetings and school collaborations.
4.3 Data Collection: Data were collected through Focus Group Discussions (FGDs):
Monthly sessions recorded participants’ experiences and perceptions.
i) Field Diaries: Volunteers maintained reflective notes on student engagement and group dynamics.
ii) Observation and Photovoice: Visual documentation captured the learning spaces’ transformation over time.
iii) Post-Intervention Interviews: Conducted with parents, students, and mentors to assess perceived changes.
4.4 Analytical Framework: Data were coded thematically using NVivo, following grounded theory procedures. Emergent themes—confidence, collaboration, belonging, and reflexivity—were mapped against theoretical categories of capital, agency, and participation.
4.5 Ethical Considerations: The project followed AACS ethical guidelines: informed consent, anonymity, and participant co-ownership of data. Reflexive positionality was maintained throughout—acknowledging that the researcher was not a neutral observer but a co-participant in the intervention.
5. Implementation: Learning as Collective Practice
The Learning Together initiative was implemented through a series of interlinked micro-interventions that transformed community spaces into learning laboratories. The goal was not only to deliver academic support but also to reconstitute the social relations of learning—to make education a participatory, relational, and emotionally inclusive process. The implementation unfolded across four major components: community mapping, structuring of Learning Circles, mothers’ collectives, and volunteer reflexivity.
5.1 Community Mapping: Discovering Learning Ecologies: The first phase of implementation began with community mapping, an ethnographic exercise designed to identify organic spaces of gathering and everyday interaction. Rather than imposing an external venue or institutional structure, the team explored where children already congregated — courtyards, tea stalls, temple verandas, and community halls. These spaces were not pedagogical by design, but they carried deep social familiarity and emotional comfort, making them ideal for trust-based learning.
Through participatory discussions, residents helped select venues that were accessible and symbolically neutral — spaces not dominated by any caste, gender, or linguistic group. This ensured inclusivity and minimized the social intimidation often experienced in formal classrooms. Each of these spaces evolved into what we called “Learning Circles,” typically comprising 6–8 students and one mentor. These circles were intentionally small to maintain intimacy and individual attention. The goal was to create “safe micro-publics” of learning — informal, dialogic, and rooted in the community’s own rhythm.
Within these Learning Circles, sessions integrated academic reinforcement with creative engagement: storytelling, local song composition, debates, drawing, and games. Lessons often drew from students’ lived experiences — discussing tea garden life, monsoon rituals, or market dynamics — thereby validating local knowledge as part of the learning process. By anchoring the intervention in everyday spaces and familiar cultural idioms, Learning Together effectively dissolved the boundary between learning and living, fulfilling the sociological aim of making education a collective social act.
5.2 Structuring Learning Circles: Blurring the Line Between Study and Sociality: The pedagogical design of the Learning Circles was flexible yet structured, balancing routine with creativity. Each circle met three times a week for 90-minute sessions, with each day dedicated to a distinct learning dimension:
Mondays: Focused on academic reinforcement—reading comprehension, basic arithmetic, and homework assistance. Mentors used multilingual scaffolding (local dialects and English) to ensure conceptual clarity and confidence.
Wednesdays: Dedicated to collaborative learning through creative expression. Activities included role play, storytelling from local folklore, song writing, and art-based learning. This was designed to foster communication, cooperation, and imaginative thinking.
Saturdays: Functioned as reflection and sharing days. Students discussed what they had learned during the week, celebrated small achievements, and collectively planned the next week’s goals. This rhythmic pattern allowed children to perceive learning as an ongoing conversation rather than a one-way transmission. The deliberate blending of academic and expressive activities blurred the traditional dichotomy between study and play, creating what Lave and Wenger (1991) describe as a “community of practice.” Moreover, by situating these sessions outside formal institutions, the project disrupted hierarchies of age, class, and language that typically structure schooling. In these circles, knowledge circulated horizontally — between peers, between mentors and mothers, and even across generations — thus democratizing the act of learning.
5.3 Role of Mothers’ Collectives: Education as Shared Care: A defining innovation of the Learning Together model was the integration of mothers’ collectives into the learning process. In many semi-urban families, mothers are central to children’s emotional and moral upbringing but remain excluded from educational decision-making due to limited literacy or social confidence. The project sought to redefine educational labour as collective caregiving, validating the knowledge embedded in domestic experience. Mothers were trained in basic facilitation skills and took charge of attendance monitoring, safety, and participation of girls. They managed schedules, prepared learning corners, and encouraged reluctant children to attend sessions. Their visible leadership transformed community perceptions of women’s roles — from passive supporters to active educators. As one participant mother remarked during an interview:
“Before, only teachers taught; now we all teach a little.”
This statement captures the essence of feminist sociology’s understanding of reproductive labour and community care (Chakraborty, 2021; hooks, 1994). Education here became an extension of caregiving, reframing motherhood as a form of pedagogical agency. The mothers’ collectives also served as a bridge between domestic and public spheres, providing a platform for women to discuss social issues, share experiences, and build confidence. Over time, this nurtured new forms of gendered social capital, positioning women as key stakeholders in the educational ecosystem.
5.4 Volunteer Reflexivity and Peer Learning: Sociology in Action: The fourth component focused on developing reflexivity among volunteers, most of whom were undergraduate students of sociology and education. They participated not as detached researchers but as engaged facilitators in a living social environment. Biweekly reflection meetings were held to discuss experiences, dilemmas, and positionality. Volunteers reflected on their own assumptions about class, language, and “good education.” These sessions revealed a gradual shift in understanding: effective teaching depended less on technical expertise and more on empathy, listening, and relational trust.
One volunteer noted in her field journal:
“I came to teach English but ended up learning how inequality speaks in silence.”
This self-realization embodies the heart of applied sociology—where practitioners evolve alongside participants. Volunteers began identifying subtle forms of exclusion within their own practices, learning to translate sociological theory into ethical pedagogy. Additionally, peer learning among volunteers became a site of knowledge co-production. Experienced mentors shared locally adapted techniques, while newcomers contributed fresh perspectives. This recursive process created a reflexive learning network that paralleled the Learning Circles themselves. Ultimately, the volunteer experience transcended mere service—it became a transformative sociological apprenticeship, shaping a generation of socially conscious educators capable of translating theory into practice.
5.5 Summary: From Implementation to Transformation: The implementation of Learning Together demonstrated that when education is embedded in social relations rather than imposed through formal institutions, it fosters not only academic progress but also social cohesion. The convergence of children, mothers, and volunteers created a microcosm of participatory democracy, where knowledge was produced through interaction, empathy, and collective reflection. Through these interconnected practices, the initiative illustrated the possibility of reclaiming education as a community common, reaffirming the sociological insight that learning, at its best, is a shared human endeavour.
6. Findings: Transformations in Learning and Social Relations
The Learning Together initiative generated a series of observable transformations at both the individual and community levels. These findings were derived from continuous field observation, reflective journals of volunteers, and focus group discussions conducted over nine months.
6.1. Reframing of Learning as Collective Practice: Initially, most participants perceived learning as an individualized, school-bound task. Over time, however, the tutoring spaces evolved into community learning hubs where knowledge was collectively produced and shared. Children began bringing siblings and friends, while mothers who were initially passive observers gradually started assisting in reading aloud or helping with simple arithmetic. This shift demonstrates a sociological redefinition of “learning” — from a hierarchical transaction to a shared social process embedded in everyday interaction.
6.2. Development of Confidence and Voice: At the outset, learners displayed hesitancy
To engage, often responding in monosyllables or avoiding direct communication. By the fourth month, classroom discourse became participatory, characterized by storytelling, peer questioning and humor. Students who were earlier silent in formal schools began articulating opinions and even debating local issues. This transformation underscores the link between social inclusion and self-expression — a central tenet in Freire’s (1970) idea of dialogic pedagogy.
6.3. Shifts in Intergenerational Relations: The program also affected the parent–child dynamic. Interviews with mothers revealed that they began perceiving their children’s education as a shared family responsibility rather than a distant institutional obligation. Retired teachers in the neighborhood, initially skeptical, became emotionally invested in the children’s progress. This intergenerational collaboration fostered new forms of social capital (Putnam, 2000), as the act of teaching became intertwined with affective and moral dimensions of care.
6.4. Emergence of Peer Leadership: A striking development was the emergence of “peer leaders”—older students who spontaneously took responsibility for helping younger ones. This self-organized mentorship expanded the project’s reach without external intervention. Peer-led sessions proved more relatable for participants, demonstrating that empowerment can diffuse horizontally within social groups when trust and recognition are nurtured.
6.5. Gendered Shifts and Safe Spaces: The creation of informal and familiar learning spaces encouraged greater participation from adolescent girls, who were often restricted from traveling far or attending evening tuition classes. The project’s spatial flexibility—using courtyards, temples, or mothers’ clubs—allowed girls to negotiate their presence in public learning activities. Over time, mothers began organizing “study evenings” themselves, signaling a subtle but profound reconfiguration of gendered spatial norms.
6.6. Strengthening of Social Networks and Trust: Perhaps the most enduring outcome was the restoration of social trust. Families that previously competed for limited tuition resources began pooling materials and sharing food during group sessions. The transformation from competition to cooperation mirrored a collective realization that educational success could be a shared community good.
7. Reflexivity among Volunteers: College students who served as tutors reported significant changes in their own outlook. Many expressed that they had gained a “sociological imagination in practice,” understanding firsthand how structural inequalities manifest in everyday schooling. Their reflective journals indicate that they began to see themselves as agents of social change rather than mere facilitators. This reflexive awareness marks a vital pedagogical outcome of applied sociology — learning through engagement. In sum, the findings illustrate that the Learning Together intervention did not merely improve academic performance; it reconstituted the very social relations that shape the learning environment. Education, in this context, became a site of empowerment, empathy, and community building
7. Discussion: Sociology as Praxis
The Learning Together initiative validates the proposition that theories gain vitality when enacted. Each theoretical strand—Bourdieu’s capital, Putnam’s networks, Freire’s dialogue—was not merely cited but embodied in practice.
7.1 Theory in Action: Bourdieu’s framework helped identify invisible barriers; Putnam’s clarified how trust networks sustain motivation; Freire’s pedagogy transformed hierarchy into collaboration. When operationalized collectively, these frameworks produced measurable social transformation—improved attendance, self-efficacy, and intergenerational dialogue.
7.2 Emotional Infrastructure: Beyond metrics, the project built emotional infrastructure—trust, care, belonging—elements often overlooked in policy design. Learning improved not solely because of instruction but because children felt seen and valued. Sociology here acts as a therapeutic science of collective well-being.
7.3 Rethinking Educational Reform: Conventional reforms treat education as a technical system; applied sociology reframes it as a relational ecology. By recognizing community agencies, it shifts responsibility from institutions alone to networks of shared solidarity.
7.4 Knowledge Co-Production: The process exemplified co-production of knowledge—where community insights refine sociological understanding. For instance, the use of folk songs as mnemonic tools emerged organically from participants, later becoming a core learning strategy. This bottom-up creativity shows that communities are not research subjects but co-theorists.
8. Policy and Practical Implications
The Learning Together initiative offers not merely a localized solution to educational inequity but a replicable framework for policy innovation rooted in applied sociology. Its implications cut across educational planning, social welfare, and gender-inclusive community development. The following recommendations arise from both field-based insights and theoretical reflection.
8.1 Integrating Sociology into Teacher Training: Teacher education in India has traditionally focused on pedagogy and content delivery while neglecting the sociological dimensions of the classroom. To make learning environments more inclusive and empathetic, sociology should be embedded within teacher training curricula. Modules on social capital (Putnam, 2000), cultural capital (Bourdieu, 1986), and participatory engagement (Freire, 1970) can help educators understand that learning is mediated by social hierarchies and cultural codes. A teacher sensitized to these dimensions can better recognize why certain students remain silent or disengaged — not due to lack of ability, but due to alienation from dominant linguistic and cultural norms. By cultivating empathy-driven pedagogy, teachers can transform classrooms into dialogic spaces where every student’s background becomes an asset rather than a deficit. Policy frameworks like the National Education Policy (NEP) 2020 already emphasize holistic learning; sociological training can operationalize that vision by grounding it in lived social realities.
8.2 Institutionalizing Community Learning Hubs: Formal schools often operate in isolation from the communities they serve. The Learning Together model demonstrates how neighbourhood-based tutoring circles can act as bridges between home and school, aligning informal learning with formal curricula. Partnerships among schools, local NGOs, and universities can institutionalize such learning hubs. College students studying sociology or education could earn credits through structured fieldwork, while retired teachers and mothers’ collectives can contribute local wisdom. This collaborative ecosystem transforms education from an institutional service into a community responsibility. Government programs like the Samagra Shiksha Abhiyan could incorporate this model by allocating micro-grants to community learning spaces. The long-term impact would be a reduction in dropout rates and an increase in parental participation — crucial indicators of social capital growth in semi-urban India.
8.3 Recognition of Informal Learning: Current educational assessment systems overwhelmingly prioritize measurable academic outcomes — test scores, attendance, and grades — while overlooking affective, emotional, and cooperative competencies that are equally vital for social integration. The Learning Together initiative provides evidence that informal learning—through storytelling, peer mentoring, and collective play—significantly enhances self-confidence and communication skills among first-generation learners. Policymakers should therefore advocate for multi-dimensional assessment frameworks that value collaboration, empathy, and social engagement alongside academic metrics. Such recognition could reshape the very notion of success in education, validating community-based knowledge systems and everyday learning as legitimate pedagogical outcomes.
8.4 Women’s Participation: Women’s engagement emerged as a cornerstone of the project’s success. Mothers who were initially hesitant observers evolved into active collaborators, managing study groups and mentoring younger children. This transformation reveals the latent educational potential of caregiving labour and the need for gender-sensitive community frameworks that recognize it.
Policies that empower mothers as educational partners can bridge the domestic–public divide that often excludes women from decision-making spaces. Integrating women’s collectives—such as self-help groups (SHGs)—into local education governance could create sustainable structures of support. This aligns with feminist sociological theory (Chakraborty, 2021; hooks, 1994), which advocates for community-based empowerment and recognizes the home as a legitimate site of social transformation. Enabling women to co-own educational spaces not only enhances learning outcomes but also contributes to broader gender justice.
8.5 Low-Cost Replicability: A significant strength of the intervention lies in its economic simplicity. With minimal financial investment—basic learning materials, local spaces, and voluntary time—the initiative achieved measurable improvements in engagement and confidence. The underlying resource was social trust, which functioned as a currency more valuable than funding. This insight has profound policy implications: it suggests that educational reforms need not depend solely on large-scale infrastructural spending. Instead, by mobilizing existing human and social capital, small communities can generate significant educational transformation. Government and NGO partnerships can replicate this model in other regions by training local facilitators, offering micro-incentives, and using low-cost communication tools. The emphasis should be on contextual adaptation rather than uniform implementation, allowing each community to evolve its own sustainable learning culture.
8.6 Toward a Sociology-Informed Education Policy: Ultimately, the Learning Together initiative urges policymakers to integrate sociological insight into the very architecture of education reform. Recognizing education as a social process rather than a purely cognitive endeavor means valuing relationships, empathy, and participation as key learning outcomes. By embedding applied sociology within education policy, India can move closer to a truly democratic model of learning—one that not only transmits knowledge but also transforms social relations.
9. Limitations and Future Scope of Research
While the Learning Together initiative demonstrates the transformative potential of community-based sociological interventions, several limitations must be acknowledged. First, the study was geographically limited to semi-urban pockets of West Bengal, which restricts the generalizability of findings. The socio-cultural fabric of this region—marked by specific linguistic, caste, and gender dynamics—may differ significantly from other Indian contexts, such as tribal belts in central India or urban migrant clusters. Future research should thus employ comparative case studies across diverse cultural terrains to test the adaptability of the model. Second, the project’s reliance on voluntary participation created inconsistencies in engagement levels. While enthusiasm among college volunteers was initially high, sustainability beyond six months required structured incentives or institutional backing. Future interventions should explore hybrid models that combine community motivation with formal recognition—perhaps through credit-based service-learning programs or local government partnerships.
Third, while qualitative data through observation and interviews yielded rich insights, longitudinal quantitative tracking of academic performance was limited. Further studies could incorporate mixed methods—combining ethnography with statistical measurement of educational progress, confidence levels, and social capital indicators—to establish stronger causal relationships. Fourth, gender representation, though organically balanced, revealed nuanced challenges. Adolescent girls often faced domestic restrictions that limited participation during certain hours. Future research should pay closer attention to the intersection of gender, mobility, and informal education, using feminist participatory frameworks (Chakraborty, 2021; hooks, 1994) to ensure equitable access.
Finally, the pandemic and subsequent digital divide limited the project’s reach to offline spaces. Exploring how low-cost digital tools—community radio, WhatsApp learning circles, or solar-powered mobile libraries—can augment social learning offers fertile ground for future investigation. Overall, the Learning Together initiative opens pathways for future scholarship that reimagines applied sociology not just as a means of studying society, but as a collaborative tool for rebuilding it
10. Conclusion
The Learning Together project underscores that sociology’s true relevance lies not in detached critique but in applied compassion— in its ability to transform communities through collective reasoning and participation. Educational inequality, when approached sociologically, reveals itself as a problem of relationships, not just resources. By redistributing cultural and social capital through community cooperation, this initiative demonstrated that the classroom need not be confined to four walls—it can be the neighborhood itself. Applied sociology thus reclaims its founding purpose: to bridge the moral and the empirical, to turn understanding into transformation. In semi-urban India, where the distance between knowledge and opportunity remains vast, such praxis can convert sociology from an academic discipline into a living instrument of justice
References
Bourdieu, P. (1986). The forms of capital. In J. G. Richardson (Ed.), Handbook of theory and research for the sociology of education (pp. 241–258). Greenwood.
Chakraborty, T. (2021). Gender, care and community in India: Feminist interventions. Routledge.
Freire, P. (1970). Pedagogy of the oppressed. Continuum.
Fritz, J. (2020). Applied sociology: Using sociological knowledge for social change. Springer.
Jeffrey, C. (2010). Timepass: Youth, class, and the politics of waiting in India. Stanford University Press.
McIntyre, A. (2008). Participatory action research. Sage.
Putnam, R. D. (2000). Bowling alone: The collapse and revival of American community. Simon & Schuster.
Sen, A. (1999). Development as freedom. Oxford University Press.
Tandon, R. (2018). Participatory research and social change. PRIA.
Uruku, N. M., & Ameh, O. R. (2026). Genetic Assessment of Fertilization, Hatchability and Survival Rate of African catfish (Clarias gariepinus; Burchell, 1822) Broodstock of River Donga Nigeria. International Journal of Research, 13(1), 158–170. https://doi.org/10.26643/eduindex/ijr/2026/10
* 1Uruku, Ndekimbe Mamndeyati and2Ameh, Oyibinga Rose
1,2Department of Fisheries and Aquaculture, Federal University Wukari P.M.B 1020, Taraba State. Nigeria.
The study on Breeding supernova of Clarias gariepinus genetic groups from River Donga Nigeria was carried out from February 2020 – March 2021 to investigate reproductive supernova among the genetic population of C. gariepinus of river Donga. Thirty (30) fish samples were utilised for the molecular analysis. DNA specimens were prepared for sequencing following standard laboratory procedure. Fish samples of the genetic groups were injected with synthetic hormone, after latency period they fish were strip of its eggs according to their haplotype’s groups, fertilized and were assessed for reproductive success and survival in the genotypes inbred (Hap1 ♀D x Hap1 ♂D and Hap3 ♀D x Hap3 ♂D) and crossbred Hap1 ♀D x Hap3♂D and Hap1 ♂D x Hap3 ♀D). The result reveal fertilization of 68.90±3.40 which was recorded in inbred haplotypes 3 (Hap3 ♀D x Hap3 ♂D) while higher hatchability of 54.03±7.23 was also observed in the inbreed of haplotype 3 (Hap3 ♀D x Hap3 ♂D) and survival of 91.71% in inbred of haplotype 1 (Hap1 ♀B x Hap1 ♂B) was recorded. Water quality parameters show positive correlation with reproductive indices. Therefore, the haplotypes, crossing method used in this research can be utilized to manage genetic resources and boost aquaculture production.
Keywords: Breeding; Crossbred; Genetics; Haplotype; Inbred; River Donga
Introduction
Breeding supernova, particularly in the context of aquatic species like Clarias gariepinus (African catfish), involves creating superior strains with enhanced traits such as growth rate, disease resistance, and environmental adaptability (Solomon et al., 2021). Genetic groups often consider both inbreeding, example; selecting for specific phenotypic traits such as faster growth or improved survival rate while risking inbreeding depression and outbreeding strategies, which can significantly affect the genetics and overall health of the populations, example; crossing local strains with genetically distinct populations to introduce new alleles that confer advantageous traits (Uruku et al., 2021). Proper management of broodstock is essential to maintain genetic diversity variability and avoid inbreeding depression, can adversely affect the performance of the offspring (Olaoye et al., 2020).
Fertilization in C. gariepinus typically involved spawning, were female broodstock release egg which are then fertilize by male milt. Successful fertilization is contingent upon several factors, including gametes quality, environmental condition such as water temperature and quality, and the timing of spawning event (Olaniyi & Omitogun, 2017). Various genetic strains may exhibit differences in these factors, leading discrepancies in fertilization rate (Ezenwo & Ajiboye, 2019). Following fertilization, the hatchability of eggs is influence by both genetic and environmental parameters. Factors such as egg viability, incubation conditions and care can all contribute to the success of hatching. Usman & Balogun, (2021) have indicated that some strains of C. gariepinus demonstrate higher hatchability rate due to enhanced genetic traits, leading to more viable embryos and improved survival rate.
Genetic groups within C. gariepinus can vary based on geographic location and breeding history. Genetic variation among strains of C. gariepinus can significantly influence reproductive outcomes. Diyaware et al. (2023) conducted a study using strains from River Benue and Gubi Dam, and the findings highlight the genetic potential of River Benue strains when involved in hybrid crosses.
Maintaining high genetic diversity is crucial for breeding programs to prevent the negative consequences of inbreeding. Using molecular tools like microsatellite or SNPs (Single Nucleotide Polymorphisms) can help in identifying genetic variation and structuring breeding programs effectively (Olaoye et al., 2020). Genetic markers are used to track the performance and health of breeding lines. The relationship between genetic strains of C. gariepinus with fertilization and hatchability is a complex interplay that holds significant implication for aquaculture. Advancing our understanding of these dynamics through this targeted research will enable the development of more robust fish stocks, there by supporting sustainable aquaculture and food security initiatives. Understanding how these genetic differences impact fertilization and hatchability is crucial for aquaculture producers aiming to optimize yield and improved sustainability (Ajayi & Ajani, 2020). Therefore, this study is aim to investigate breeding supernova (success) of C. gariepinus in river Donga, Taraba State Nigeria.
Donga river lies between latitude 7°43′00″N and longitude 10°03′00″E. It has an area of 3,121 km² and a population of 134,111 at the 2006 census, figure 1. The Donga River is a river in Nigeria and Cameroon. The river arises from the Mambilla Plateau in Eastern Nigeria, forms part of the international border between Nigeria and Cameroon, and flows northwest to eventually merge with the river Benue, Nigeria. The Donga watershed is 20,000 square kilometres (7,700 sq mi) in area. At its peak, near the Benue the river delivers 1,800 cubic metres (64,000 cu ft) of water per second. A lot of fishing activities go on in the River and thus fishing is an occupation in the area (Inger et al., 2005).
Figure 1: Map showing locations of sampling site, River Donga a Tributary of river Benue
Procurement of fish samples
A total of thirty (30) broodstock each of C. gariepinus (average weight of 1000-1500g) both males and females were bought from artisanal fishermen. Fish were caught with various fishing gears at the River Benue, Taraba State, Nigeria. Gross physical examination of the external features of the samples were undertaken for abnormalities at the main landing site and samples obtained from the two Rivers were transported in plastic troughs (60cm diameter × 30cm deep) to Kahzuh integrated farm which is a leading modern Technological driven farm which lies on latitude 8º5′ 2.472ʺ N and longitude 9º47’34.008ʺ E in Gindin Waya, Ibi LGA, Taraba State Nigeria. It is bounded in the south by Benue state, North by Gassol LGA, East by Wukari LGA and West by Ibi LGA. Gindin Waya agro – ecological zone is the southern guinea savanna and it characterized by tropical hot/wet with distinct rainy and dry seasons. The hormone (Ovulin) was procured from Agro-service Centre Jos, Plateau State.
Broodstock Selection
Mature gravid females were selected based on swollen, well distended soft abdomen, reddish vent and gentle extraction of few eggs by pressing the fish abdomen using the finger. Females with sharp golden colored eggs were selected. Matured males were also selected based on their reddish pointed genital papillae. Only 30 matured specimens were utilized for this study.
Transportation/Acclimation of Clarias gariepinus Broodstock
The selected C. gariepinus broodstocks (male and female)were acclimatized in mobile holding ponds for a period of eight (8) weeks before artificially induced breeding were carried out.
Molecular Diagnosis and Separation of specimens to Genotypes
During acclimation period, caudal fin clip of about 1g each were obtained from each of the thirty (30) specimens of C. gariepinus and sent to IITA, Ibadan for gene extraction and genotyping by sequencing (GBS), to ascertain genetic divergence in the population. These were inferred by 16S rRNA primers. In order to achieve this, standard laboratory procedures of DNA extraction, polymerase chain reaction, cloning and sequencing were utilized it was then followed by bio-informatics analysis.
Experimental design
Both the parental and the intra – specific crosses were repeated three times in complete randomized block design (CRBD) manner, having hatchlings each after taking the pool weight and both were collected and stored in the aerated bowls. The survival of fry in each bowl per treatment were taken after egg yolk absorption.
Hormone preparation
Ovaprim: it does not require any special preparation. It was used to aid spawning in the reproductively matured female Catfish. Ovaprim (Western Chemical Inc. Femdale, WA) is marketed in liquid form and administered at the dosage of 0.5ml per Kg of each test brooder.
Administration of spawning agent (hormones)
The weight and length of the gravid female and male brooders were measured and induced with the hormones ovaprim at a dosage 0.5 ml/ kg/body weight for female following Efeet al.(2015).
Stripping of eggs from female brooders
The body of the female brooders were mopped dry and pressure was applied gently on the abdomen of the female brooders injected with spawning agent (Ovaprim). Ovulated eggs from the genital opening was collected in a plastic bowls with labels: strain-wise and weighed separately.
Fertilization and hatchability rate were estimated following Lambert, (2008) formulae.
Artificial fertilization of eggs
Spermatozoa (milt) from the mature male haplotype was used to fertilize the eggs in the labeled bowls in the following cross combination replicated in triplicate:
Experimental crosses
The following generic combinations were carried out:
Design for the Reproductive characterization
Haplotypes Location
River Donga
Haplotype 1 Equal number, equal size, equal sex ratio across the two locations
Haplotype 2 2
Haplotype 3 Equal number, size, sex ratio across the two locations as in Haplotype 1
Incubation of the fertilized eggs were carried out in circular plastic bowls of 90cm diameter and 45cm depth with a carrying capacity of 120 litres of water each. The incubating tanks were interconnected flow through system and the fertilized eggs were spread in single layers on a net that was suspended in the incubating tanks to avoid overlapping of the eggs which could result in clogging. Hatching was observed between 18 – 28 hours. Both the parental and the reciprocal crosses were repeated three times in a complete randomized block design (CRBD) manner.
The water quality of the system of culture (hatchery unit) was monitored daily for: Temperature, pH, Dissolved oxygen, Ammonia (NH3) and Electric Conductivity. The analysis was done immediately after water samples collection. The parameters were determined insitu using a multi parameter water checker from the various hatching tanks;
Statistical analysis
Data on production and reproductive indices was analyzed using Minitab 14 software for descriptive statistics and Genstat Discovery edition 4 for analysis of variance (ANOVA) with respect to inbreed and their reciprocal crosses. Post hoc test was carried out using Duncan Multiple Range Test (DMRT) to determine the differences between the means (P=0.05) using SPSS version 20.0.
Results
Reproductive Success in the Haplotypes of C. gariepinus from river Donga
Results of the percentage hatchability, fecundity and percentage survival (Day 3) of fry of the inbreed and crossbred C. gariepinus from river Donga haplotype were as shown in Table 1. Equal weight of eggs was obtained for all the crosses. The highest percentage fertilization (68.90%) was recorded in inbred (Hap3 ♀D x Hap3 ♂D) and the lowest (45.86%) in inbred (Hap1 ♀D x Hap1 ♂D) strain. The highest percentage hatchability (54.03%) was recorded in inbred (Hap3 ♂D x Hap3 ♀D), followed by crossbred Hap1 ♀D x Hap3 ♂D (49.11%), and the least percentage hatchability of 39.51% was recorded in (Hap1 ♀D x Hap1 ♂D). The highest survival value of 91.71% was recorded in inbred Hap1 ♀D x Hap1 ♂D followed by crossbred Hap1 ♀D x Hap3 ♂D (90.53%), and the least percentage survival rate of 87.91% was recorded in Hap3 ♀D x Hap3 ♂D.
Table 1: Determination of Fertilization, Hatchability and Survival Rate of River Donga Haplotype
Hap1 ♀D x Hap1 ♂DHap3 ♀D x Hap3 ♂DHap1 ♀D x Hap3 ♂D Hap1 ♂D x Hap3 ♀D
Weight of eggs(g) 5.00±0.00 5.00±0.00 5.00±0.00 5.00±0.00
Estimated No of eggs3000.00±0.00 3000.00±0.00 3000.00±0.00 3000.00±0.00
No. of fertilized eggs1375.67±172.79 2067.00±110.94 1556.67±313.79 1940.00±184.29
No. of hatchlings 532.00±192.171112.00±94.00 768.670±195.68 922.33±164.20
Inbreed = (Hap1 ♀D x Hap1 ♂D – Haplotype 1 female crossed with Haplotype 1 male and Hap3 ♀D x Hap3 ♂D – Haplotype 3 female crossed with Haplotype 3 male).
Crossbreed = (Hap1 ♀D x Hap3 ♂D – Haplotype 1 female crossed with Haplotype 3 male and Hap1 ♂D x Hap3 ♀D – Haplotype 1 male crossed with Haplotype 3 female)
Table 2shows that among the water quality parameters of river Donga haplotype,temperature positively correlated strongly with only percentage survival at Day 3 at r = 0.79 and negatively correlated with number of fertilized eggs, number of hatchlings, percentage fertilization, percentage hatchability and survival at Day 3 at r = – 0.84, – 0.76, – 0.84, – 0.53 and – 0.73 respectively. pH shows positive correlation with number of fertilized eggs, number of hatchlings, percentage fertilization, percentage hatchability and survival at Day 3 at r = 0.89, 0.79, 0.89, 0.64 and 0.77 respectively and negatively correlated strongly with only percentage survival at r = – 0.94. Dissolved Oxygen correlated positively with number of fertilized eggs, number of hatchlings, percentage fertilization, percentage hatchability and survival at Day 3 at r = 0.51, 0.69, 0.51, 0.89 and 0.73 respectively and negatively correlated with only percentage survival at r = – 0.49. Ammonia strongly correlated positively with number of fertilized eggs, number of hatchlings, percentage fertilization, percentage hatchability and survival at Day 3 at r = 0.80, 0.90, 0.80, 0.98 and 0.92 respectively and negatively correlated strongly with only percentage survival at r = – 0.80. while electrical conductivity weakly correlated positively with all the water parameters.
Table 2: Correlations (r values) of Water Quality Parameters and Reproduction indices of Studied River Donga Population
Temperature (OC) pH D.0(mg/L) NH3(mg/L) Electrical Conductivity
No of fertilized egg -0.840.890.510.80 0.06
No of hatchlings -0.760.790.690.90 0.17
% Fertilization -0.840.890.510.80 0.06
% Hatchability -0.530.640.890.98 0.17
Survival at Day 3 -0.730.770.730.92 0.18
% Survival 0.79 –0.94 -0.49 -0.80 0.07
* Indicates that correlation is significant (P> 0.05).
Discussion
Breeding supernova of C. gariepinus
Breeding supernova in fish is a key focus in aquaculture as it directly affects productivity. The feasibility of crosses among the haplotype of C. gariepinus and its reciprocal cross-breeding was demonstrated in the present study. Fertilization and hatchability in this study is higher in value but similar in trend to the observations of Olaniyi & Akinbola, (2013) for C. gariepinus induced with Ovaprim (46.3%). The high hatching percentage observed in inbreed haplotype (Hap3 ♀D x Hap3 ♂D) 54.03% of river DongaC. gariepinus might be attributed to the genetic improvement through molecular diagnosis. The phenomenon of higher fertilization and hatchability in inbred versus crossbred C. gariepinus is complex and may be attributed to several factors, including genetics, reproductive biology and environmental adaptation (Yu et al., 2020).
Inbred population can sometimes exhibit greater genetic compatibility, especially if they have been selectively bred for desirable traits. This can lead to a higher rate of fertilization as gametes may be better suited to combine effectively (Fitzsimmons, 2000). Eknarth & Acosta, (1998) ascertained that inbred tend to have a more uniform genetic background, which can reduce the occurrence of incompatible gene interactions during fertilization and embryonic development. If the alleles controlling fertility traits are more consistent in inbred groups, this can result in higher fertilization rate.
Yu et al. (2020) revealed that where the genetic makeup of the female influences the success of fertilization and embryonic development can be more pronounced in inbred lines, leading to improved hatchability. If the inbred group have been adapted to specific farming conditions (such as water quality, temperature, or feeding regime), they may demonstrate better reproductive performance in those environments compared to crossbred haplotypes, which may be more variable in their response to environmental factors (Ajayi & Adesola, 2012).
It is however important to acknowledge that differences that arise from breeding history, age and water quality can affect hatching rates. Variations in seasons can also lead to differences in hatching rates, as rightly observed by de Graaf et al. (1995). So as long as fecundity does not drop, hatching rates and survival rates of larvae remain the key to viable and economically beneficial production of catfish fry and fingerlings.
The high survival rate of crossbreed haplotype of C. gariepinus during day 3 of rearing may be related to its hardiness and adaptation to environment. This is in agreement with Olufeagba and Okomoda (2015); Omeji et al., (2013) who reported high survival rate of local C. gariepinus reared under a medium stocking density for a short duration in protected tanks. Crossbreeding is used to achieve improved traits (heterosis), minimize inbreeding and obtain better hybrids (Jothilakshmanan & Karal Marx, 2013). Akankali et al. (2011) reported that apart from being able to obtain quality seed, the artificial propagation technique can also be used to develop strains superior to their ancestors by the methods of selective breeding, hybridization and molecular characterization.
Various factors related to water quality can influence reproductive success, growth and survival rates of aquatic species. Understanding the correlation between water quality and reproductive indices is essential for the management and conservation of aquatic ecosystems. Mean water parameters recorded shows positive correlation with the reproductive indices during the experimental period, temperature, pH, dissolved oxygen (DO) and ammonia were within the range of optimal levels for good growth and survival of C. gariepinus seeds.
Conclusion
Developing a breeding supernova for C. gariepinus combines aspect of genetics, aquaculture practices, and environmental consideration. Therefore, careful planning, selection, and management of genetic diversity can produce robust strains that will contribute to sustainable aquaculture production.
Ajayi, O. O., & Ajani, E. K. (2020). Genetic variation in reproductive traits of Clarias gariepinus in aquaculture practices. Aquaculture science, 68(3): 341-352
Akankali, J. A., Seiyaboh, E. I., & Abowei, J. F. N. (2011). Fish hatchery management in Nigeria. Advance Journal of Food Science and Technology. 3(2): 144-154.
deGraaf, G. J., Galemoni, F., & Banzoussi, B. (1995). The artificial reproduction and fingerling production of the African catfish Clarias gariepinus (Burchell, 1822) in protected and unprotected ponds. Aquaculture Research, 26, 233-242.
Diyaware, M. Y., Okomoda, V. T., & Ekam, V. S. (2023). Selective breeding responses and growth performance of hybrid strains of Clarias gariepinus from River Benue and Gubi Dam, Bauchi. Nigerian Journal of Fisheries, 20(1): 100-108. https://www.ajol.info/index.php/njf/article/view/265313
Efe, O., Ebere, S. E., & Nenibarini, Z. (2015). Evaluating the efficacy of pituitary gland extracts and ovaprim in induced breeding and fry quality of Clarias gariepinus, Burchell (Pisces:Claridae). Journal of Agriculture, Forestry and Fisheries, 4(7): 1-6. Doi: 10.11648/j.aff.20150402. 18
Eknarth, A.E., & Acosta, B. O. (1998). Genetic improvement of catfish: The role of inbreeding and hybridization. Aquaculture research, 29(5): 1-13. https://doi.org/10.1046/j.1365-2109.1998.00
Ezenwo, V. O., & Ajiboye, A. A. (2019). Selective breeding for improved fertilization and hatchability of Clarias gariepinus: a review. International Journal of aquaculture, 10(1): 58-67.
Fitzsimmons, K. (2000). Catfish farming: A sustainable practice? Aquaculture magazine, 26(2): 10 -13.
Inger, A., Ousmane, D., Martha, J. H., & Jean-Claude, O. (2005). “The Niger River Basin: A Vision for Sustainable Management” (PDF). World Bank. Retrieved 2024 – 06 – 09. https://openknowledge.worldbank.org/handle/10986/15018
Jothilakshmanan, N., & Karal Marx, K. (2013). Hybridization between Indian catfish, female Hetropneustes fossilis (Bloch) and Asian catfish, male Clarias batrachus (Linn). 12(9): 976-981. doi:10.5897/AJB11.3215
Lambert, Y. (2008). Why should we closely monitor fecundity in marine fish populations. Journal of Northwest Alternative Fisheries Science, 41, 930-106.
Olaniyi, C. O., & Akinbola, D. O. (2013). Comparative studies on the hatchability, performance and survival rate of African catfish (Clarias gariepinus) larval produced: using ovaprim and catfish pituitary extract hormones. Journal of Biolology, Agriculture and Health, 3, 57-63.
Olaniyi, C. O., & Omitogun, O. G. (2017). Comparative performance of inbred and crossbred African catfish (Clarias gariepinus) for aquaculture in Nigeria. Journal of Fisheries and Aquatic Science, 12(4): 139-147.
Olaoye, O. J., Akinwande, A. A., & Ayeloja, A. A. (2020). Genetic diversity assessment of African catfish (Clarias gariepinus) populations in River Donga, Nigeria. Nigerian Journal of Fisheries and Aquaculture, 8(1): 1-9.
Olaoye, O. J., Akinwande, A. A., & Ayeloja, A. A. (2020). Genetic diversity assessment of African catfish (Clarias gariepinus) populations in River Donga, Nigeria. Nigerian Journal of Fisheries and Aquaculture, 8(1): 1-9.
Olufeagba, O., & Okomoda, V. T. (2015). Preliminary report on genetic improvement of Heterobranchus longifilis through intraspecific hybridization of different strains from Nigeria. Journal of Aquaculture engineering and fisheries research, 1(1): 45 – 48.
Omeji, S., Obande, R. A., & Oyaje, J. (2013). Intra-specific hybridization of local and exotic Clarias gariepinus. International Journal of Modern Biological Research, 1, 34-41.
Solomon, R. J., Eyo, J. E., & Ekanem, A. P. (2021). Performance evaluation of hybrid and purebred catfish strains in Nigerian aquaculture. International Journal of Fisheries and Aquatic Studies, 9(2): 72-77.
Uruku, N. M., Adikwu, I. A., Oyebola, O. O., & Akombo, P. M. (2021). Genetic diagnosis on strains of the African Catfish, Clarias gariepinus (Burchell, 1822) in River Benue and a Tributary in North East Nigeria. International Journal of Fisheries and Aquatic Studies, 9(3): 91-97.
Usman, R. A., & Balogun, T. J. (2021). The influence of environment on hatchability and growth in different strains of Clarias gariepinus. Journal of fisheries and aquatic science, 16(2): 114-123.
Yu, K., Hu, Y., & Zhang, M. (2020). Genetic diversity and hybridization effects of Clarias gariepinus; implications on hatchery success. Fish physiology and biochemistry, 46(2): 425 – 435. Doi.10.1007/s10695-020-00795-4


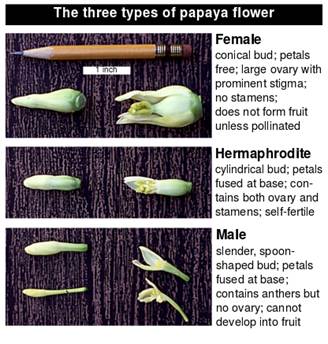


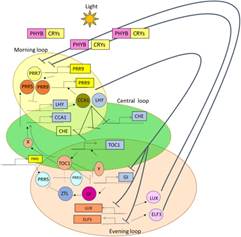


You must be logged in to post a comment.